-

-
-
-
-
-
-
Collings, T.,
-
-
-
-
Hoch, J.,
-
-
-
-
-
-
-
-
-
-


A new research paper led by our Chief Research Officer Dr Oliver Wing and co-authored by numerous Fathomers applies new techniques to simulate the behavior of floods. Assessing these methods against a series of benchmarks results in the most comprehensive validation of large domain flood modeling yet published, and Critical Success Index scores (CSI) demonstrate an unprecedented level of fidelity for a global flood map.
The research in this paper underpins Fathom’s award-winning Global Flood Map.
“This research represents the culmination of years of research on our quest to help future-proof communities around the world from the evolving risk of flooding. The findings underscore the vital importance of all countries keeping their promise to cut carbon emissions.”
– Dr Oliver Wing, Chief Research Officer at Fathom
The evolution of global flood models
Flood mapping has developed rapidly over the past decade, with improvements in a range of areas such as resolution and climate change representation. Where observational data or previous models were incomplete, these advances have allowed us to answer urgent practical and scientific questions around flood risk that couldn’t be addressed in any other way.
Yet despite progress made, limitations have remained with the likes of scope, function and accuracy, restricting the usability of these flood maps. After all, flooding is such an intensely local problem, it requires extremely detailed data to produce skilful global and continental scale predictions.
At Fathom, we have seen this evolution of flood models reflected in our own products. The native resolution of the computations in the first iteration of our Global Flood Map was 30 arc seconds or ~ 900 m, a figure which was reduced to 3 arc seconds or 90 m in our second version. Now our third Global Flood Map offers 30 m resolution, and this example is just one of the significant improvements to our global flood inundation modeling capabilities made over the years.
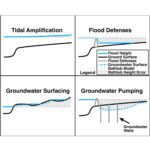
Another key limitation across flood models is the limited classes of flooding that are represented. Numerous global inundation models only represent fluvial flooding, with river channels only explicitly represented in a handful of these, and relying on a crude approach to determine channel depth. Meanwhile, coastal flooding has thus far been ignored – a significant omission.
Key updates to the Global Flood Map
This paper describes a new and updated version of Fathom’s Global Flood Map, addressing a number of key challenges while also taking advantage of recent advances in global data generation. Major changes include:
- For the first time, all three main flood types are represented at a global scale: coastal, fluvial and pluvial. The coastal component was created in collaboration with Professor Ivan Haigh from the University of Southampton.
- Switching the underlying DEM used by the model to FABDEM, a corrected version of Copernicus DEM with forest and buildings removed, which has been shown to offer significant advantages over alternatives.
- Using a newly developed gradually varied solver approach (outlined in a research paper led by our Chief Scientific Advisor, Professor Jeff Neal) to estimate channel capacity, which yields significant improvements in bathymetry estimation, and inundation simulation as a result. This approach is applied to our UK and US Flood Maps, as outlined in the associated research papers led by our Chairman Professor Paul Bates.
- Adopting new machine learning (ML) techniques to generate flood frequency curves globally to provide more robust model boundary conditions, building on recent research by Dr Gang Zhao into flood defense standard estimation, and by Tom Collings into global extreme sea level estimation.
- Representation for any 21st century climate scenario with uncertainty bounds, via sampling of explicitly simulated return period flood maps according to climate change factors.
Numerous other updates – such as an increase in data available for training – can also be found throughout the paper.
Validation and CSI scores
To validate the model, outputs are compared to regional and national engineering flood hazard maps, as well as observed high water marks, satellite flood images and post-event reconstructions of maximum flood extent for historical events. To the authors’ knowledge, the quantitative validation tests carried out on Global Flood Map represent the most comprehensive evaluation of a global flood-mapping framework ever presented.
For flood extent comparisons, this paper demonstrates that Global Flood Map achieves a critical success index (CSI) of ~0.75. Meanwhile, more discriminatory tests of flood water levels show a deviation from observations of approximately 0.6m on average.These scores are approaching the accuracy ceiling, due to errors in the observed data. Results of this level of global model fidelity are unprecedented in the literature.
Similarly impressive results can be found throughout the paper. For example, when assessing the approach to defining the fluvial boundary conditions, a 10-fold cross-validation procedure is employed to compare the performance of this updated ML-based index flood model. The results showed a reduction in mean absolute error from 126% to 57%, while the interquartile range in error across all river gauges is reduced from 101% to 40%, with any bias effectively eliminated. For context, gauge observations of river flow during average in-bank conditions can have errors up to 40% or more during floods, with further errors occurring when limited data records are extrapolated statistically to estimate the most extreme floods. In short, a mean absolute error of 57% is approaching gauge error for flood flow estimation.
Overall, the validation results for Global Flood Map appear to show a global flood model superior to any previously published and on par with large-scale national maps. In some cases it is even capable of locally skillful predictions. It is important to note that validation data availability is strongly correlated with data-richness, and for data-poor areas such as Africa, fewer flood observations are available and model input data may be lower quality, meaning we might reasonably expect test scores for these areas to be lower.
Global flood hazard under climate change
Integrating these inundation maps with the most flood-relevant climate model outputs available has resulted in the most reliable projections of flood hazard under climate change to date.
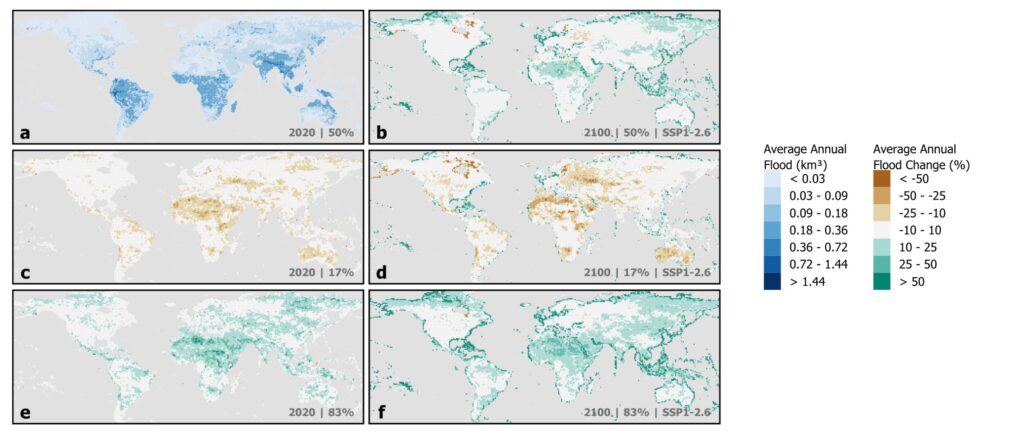
To illustrate how climate change impacts flood hazards on a global scale, the research team computed the average annual flood volume for 1 degree grid cells, integrating the volume of floodplain inundation at each return period for a given scenario.
“It is important to note that these global averages result from predicted changes in hazard that have large geographical variations. Some places will see their flood risk fall, whilst for others the increases will be many times larger than the global average even under a lower emissions scenario.”
– Dr Oliver Wing, Chief Research Officer at Fathom
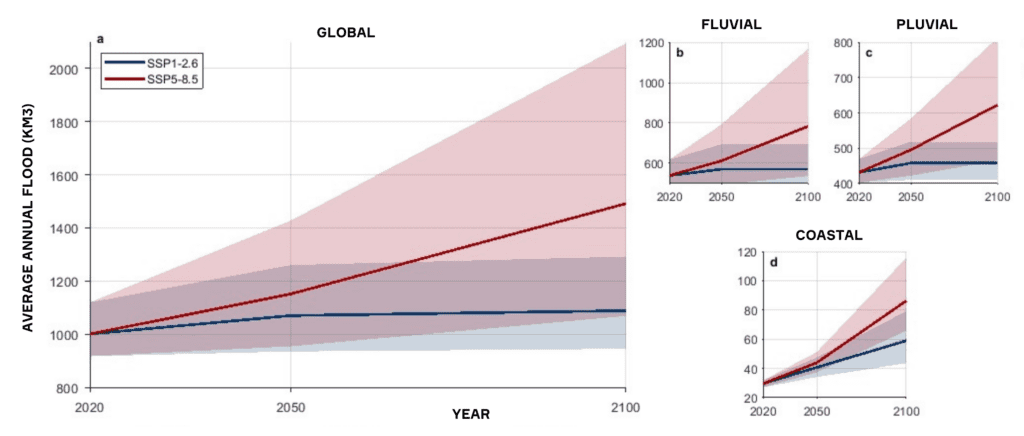
The below graph shows the change in flood hazard from a 2020 baseline to 2100 under IPCC highest and lowest climate emissions scenarios: SSP5-8.5 and SSP1-2.6 respectively. For SSP5-8.5 the increase in flood hazard to 2050 is 15% (with a likely range of -5 to 43%), while the increase for SSP1-2.6 is 7% (with a likely range of -7 to 26%). The latter, optimistic scenario of emission reductions keeps flood hazard increase low and well within the 2020-centered -8 to 12% hazard estimate uncertainty range. By 2100, the SSP5-8.5 and SSP1-2.6 scenarios diverge enough to demonstrate that most possible SSP1-2.6 outcomes are implausible in a SSP5-8.5 world. Looking at the three graphs, it is clear that the increase to coastal flooding is larger and more certain than the other two perils. This is due to a lagged response of the oceans to existing warming; even under SSP1-2.6 coastal flood hazard is expected to increase by 99% by 2100.
It is worth noting that such overlap in uncertainty bounds between the different emission trajectories demonstrates that flood hazard predictions conditioned with climate models remain imprecise.
What’s next for global flood modeling?
Nine years since the first Global Flood Map was launched, the research team has now completed the most comprehensive validation of a large-domain flood model yet published, and with CSI scores approaching the limit imposed by flood observation errors.
“Undertaking this research project involved subjecting our findings to the most comprehensive benchmarking of global flood modeling yet published. With the highest resolution results produced to date, we hope industries will derive value from our model for a range of additional use cases, such as protecting critical infrastructure from future flooding, helping insurers price premiums and meeting the requirements of climate regulations.”
– Professor Paul Bates CBE, Chairman at Fathom and Professor of Hydrology at the University of Bristol
This step change in model fidelity – alongside enhancements to model functionality such as the coastal inundation, climate projections and uncertainty representation – presents a global flood model suited to a variety of use cases from reinsurance pricing and financial portfolio asset valuation to regional infrastructure planning and disaster event response.
Though the field remains inhibited by issues such as the lack of quality global-scale inundation observations, which likely won’t be fixed in the short-term, there are tangible model improvements on the horizon. This includes data from the Surface Water Ocean Topography (SWOT) mission, a satellite survey of the Earth’s oceans and surface waters repeated every 21 days. Launched in December 2022, this instrument will provide water height and slope measurements for the oceans and inland water bodies with an unprecedented level of detail. Once completed, the data from SWOT will eliminate critical barriers to global inundation model development and will likely underpin the next generation of models.
Did you know our Chairman was one of the team who first conceptualized the SWOT satellite mission in 2004?
The research team also highlights the value of such research in future impact-focused work, similar to the paper published by Dr Oliver Wing on the social inequalities of flood risk in the US, following the publication of Fathom’s US Flood Map methodology in Water Resources Research in 2020.
Read the research paper in full on Water Resources Research
Related research
Introducing BURGER, Fathom’s new extreme rainfall dataset

Satellite Requirements to Capture Water Propagation in Earth’s Rivers

Global River Topology (GRIT): A bifurcating river hydrography

Increasingly seasonal jet stream raises risk of co-occurring flooding and extreme wind in Great Britain

A first attempt to model global hydrology at hyper-resolution

Flooding is not like filling a bath