


A new climate-conditioned catastrophe flood model for the UK for historic and future conditions using climate simulations
New research from Bates et al. describes the creation of a transparent flood model for the UK that simulates pluvial, fluvial and coastal flood risks for 10 different return periods.
These cover the whole of the UK and include historic, current and future forecasts using the UK Climate Projections 2018 climate simulations.
The paper, by Fathom’s experts Prof Paul Bates, Dr James Savage, Dr Ollie Wing, Dr Niall Quinn, Dr Chris Sampson, Dr Jeff Neal and Dr Andy Smith and in partnership with the University of Bristol, contains a greater level of detail and nuance to previous work, and represents what is currently our best understanding of the UK’s evolving flood risk landscape. It sets out the framework for building complex and robust present day and future flood models, and is the methodology behind Fathom’s UK catastrophe model, Fathom-UK CAT; a first for accurately quantifying present and future flood losses.
Flooding is the principal environmental hazard identified in the UK’s National Flood Risk Register, with past major events resulting in substantial economic losses and even loss of life. Despite the threat posed by floods, the methods currently used to map national-scale flood hazard and risk in the UK are, at best, opaque. In addition, data sets available for flood research either represent a limited range of return periods, do not consider the spatial correlation in flood hazard, or do not account for climate change impact.
To address this, the team has created a climate-conditioned catastrophe risk model for UK pluvial, fluvial and coastal flooding for 10 return periods; historic, current (2020) and future conditions (2030, 2050, 2070) under the Representative Concentration Pathway 8.5 carbon emissions scenario. This research is an in-depth investigation into the methods and approaches underpinning Fathom-UK CAT.
Key findings
- The forecasted increase in average annual flood losses (i.e. damage to property and businesses) above recent historic levels as a result of climate change can be restricted to a maximum of ~4%. But Great Britain will only be able to avoid a major increase in climate change-related flood risk if all countries’ COP26 and net zero emission reduction pledges are met in full.
- If these targets are missed, the annual cost of flooding in the UK over the next century could grow by between 13% and 23% above recent historic levels, depending on different levels of climate extreme projections.
- Current analyses of UK Expected Annual Damage due to flooding have previously been shown to be three times greater than loss observations reported by the Association of British Insurers. However, the team’s new analysis is, for the first time, able to replicate the ABI historic loss data giving greater confidence in the future projections.
- Current assessments of flood hazard and risk in the UK are not exposed to independent peer review and are therefore not repeatable or validated. As a result, review and improvement cycles are restricted and the number of researchers who can contribute to the science is greatly reduced, creating a significant barrier to progress.
- The UK is not well adapted to its existing flood risks, let alone any further increases that climate change will bring. Most places at risk of future flooding are already at risk now. It follows that strengthening flood management at already at-risk areas is the best thing we can do to prepare for climate change.
Check out the original news story and some highlights from the media attention it received
“For the first time, this flood model gives us an accurate and detailed picture of the impact of climate change on the risk of flooding in the future across the UK. The results are a timely warning to the country’s political leaders and business sector that global commitments to significantly reduce carbon emissions must be taken very serious, and ultimately take effect, in order to mitigate increased losses due to flooding.”
Lead author Prof Paul Bates
Validating Fathom-UK and Fathom-UK CAT
Model validation is first conducted using equivalent return period flood extent maps produced by the Environment Agency and Natural Resources Wales. An exact match is not expected in all locations, given a difference in approaches – such as coastal areas of local maps modeled using “bathtub” GIS mapping, which can be an overestimation of the true hazard data. Instead, they look for broad consistencies when examining the data at scale. Metrics used include the false alarm ratio, hit ratio, error bias and the critical success index (CSI). The overall CSI scores produced in the team’s model for England and Wales are shown to fall within the typical range found in comparisons of flood models to airborne and satellite observations of inundation extent.
Within the paper, the team provides a comparison of fluvial and coastal hazard layers produced by their model, displayed alongside the equivalent government flood hazard maps. Areas displayed include:
- The tidal and fluvial flooding in London.
- Predominantly coastal flooding around the area of the Wash tidal embayment in Eastern England.
- Fluvial flooding surrounding Tewkesbury in Central England at the confluence of the Severn and Warwickshire Avon rivers.
Expected annual damage produced by the team’s model is also validated against the Association of British Insurers’ (ABI) observations of annual insured losses. A corresponding graph in the paper shows these observed annual losses, their correlation with the new model analysis conducted by the paper’s authors, and the disparate figures from estimated annual values from previous modeled analysis. In short, the expected annual damages from the previous UK model analysis are three times greater than ABI observed losses, and they lie well outside the distribution of the samples used by the team.
Read more about how Fathom’s data helps insurers build their own view of risk
Thanks to the hazard and risk validation undertaken by Bates et al., the catastrophe model outlined in this paper appears to be a reasonable representation of UK flood patterns and losses. With this in mind, the team moves on to risk projections against climate change.
Projecting changes in future flood risk
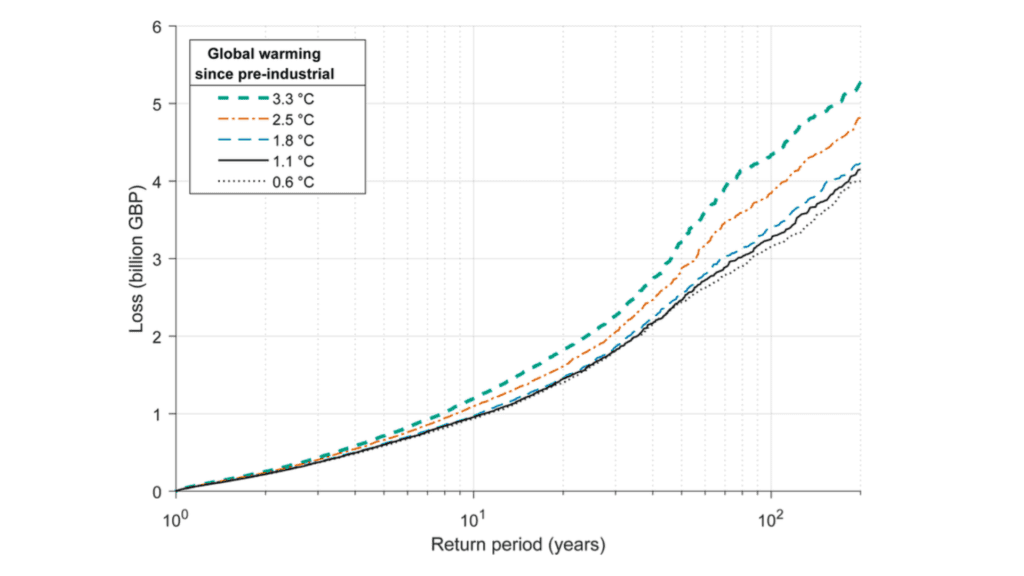
Once the validation is complete, the paper looks to the future. A specific global warming level of 1.1 degrees celsius represents present day (i.e. 2020 in the case of the data). Meanwhile, a threshold of 0.6 degrees forms the baseline, derived from observational records and represents a historic average centered on approximately 1990. The team compares this figure to the expected temperature increase if different climate scenarios were to occur and using their model, maps the forecasted flood loss for each level of global warming. The results show that Great Britain will only be able to avoid major increases in climate change-related flood risk if all COP26 and net zero emission reduction pledges are met in full.
Finally, the team provides a spatial distribution for expected annual damage across the UK. This compares the baseline forecast with the 1.8 degree celsius of warming that represents a world in which the Paris Agreement targets are met. The map clearly demonstrates how analyzing at a national scale is concealing dramatic changes in risk based on geography.
“Although the most optimistic climate scenarios see only modest increases in flood losses at a national level, these new data demonstrate how this conceals dramatic variations across the country, with some places seeing large changes and others very little. This is a result of changing patterns of future rainfall, river flow and sea level rise, and this leads to the regional differences we predict.”
Prof Paul Bates
Methodology
The team produced this analysis through the following process:
- The creation of hazard layers across the UK for specified return period intervals and climate scenarios.
- The characterisation of spatial dependence in flood discharge and synthetic event catalog generation.
- The creation of flood event footprints through sampling from the existing hazard layers.
- The intersection of exposure data with vulnerability functions and event depths to estimate loss.
- Projection of these results into the future, based on the latest UKCP18 climate projections from the Met Office.
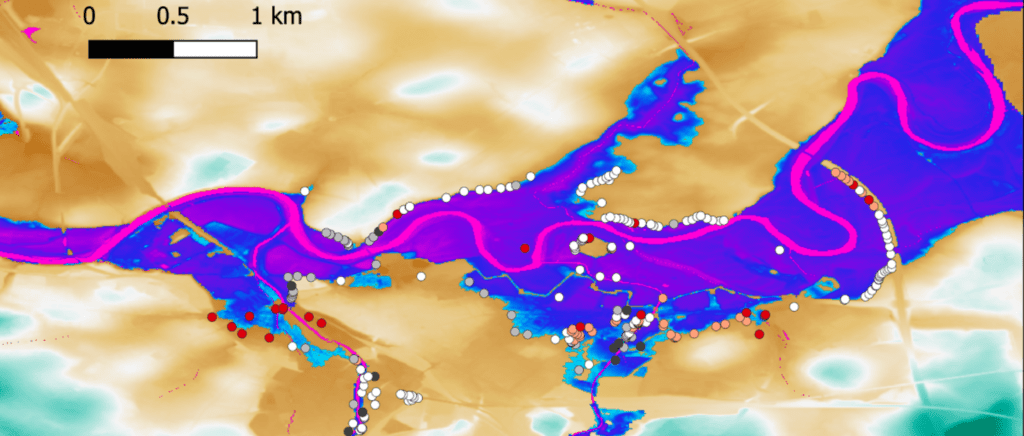
At the heart of the model lies a 1D/2D hydraulic model that dynamically simulates fluvial, pluvial and coastal flood events across the UK.