US Flood Map
The most complete and technologically advanced flood map
for the United States
Uncover comprehensive and climate-driven flood hazard information for both inland and coastal perils with Fathom’s US Flood Map. Available as either a flood depth or Risk Scores, the map utilizes the latest observation, terrain, and climate information. The result is the most technologically advanced, country-wide flood map. For anybody seeking to understand flood exposure, US Flood Map is the complete picture.
Key features of Fathom’s US Flood Map
Future climate
Represent all plausible futures with our fully flexible Climate Dynamics framework. Build hazard data for any emissions scenario, time horizon or temperature change
Flood layers
— Depths for return periods between 1-in-5 to 1-in-1000 year
— Risk Scores for each type of flooding
Terrain data
Fathom has compiled the most accurate digital terrain model of the US –FABDEM+. The data consists of a large proportion of up-to-date LiDAR imagery that has been blended with cutting-edge FABDEM terrain data, in areas where local terrain data are unavailable
High-resolution inland and coastal flooding
— Total representation of fluvial, pluvial and coastal flooding
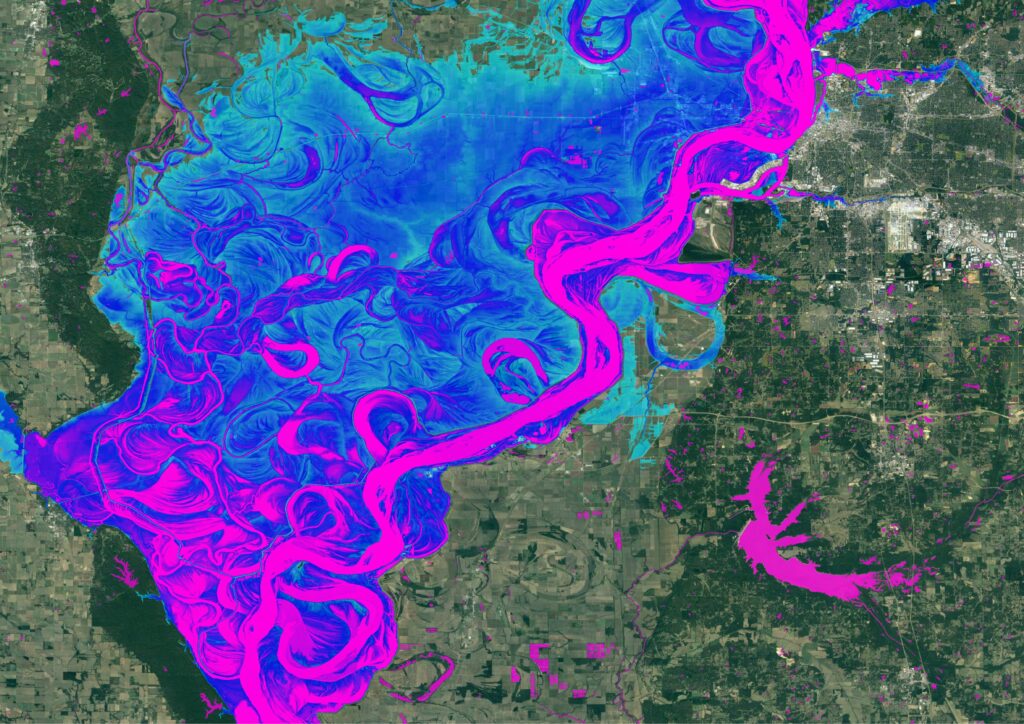
— Simulation of flooding for all river channels, irrespective of size, including even the smallest of flow pathways
— All available at ~10 meter resolution – 1/3 arcsecond data
Access
Gain instant on-demand access via the Fathom API and Fathom Portal, direct provision or via a partner
Discover Fathom’s options for access
Fathom’s US Flood Map is also available in CatNet®, Swiss Re’s leading location intelligence platform. Book a consultation to learn how you can leverage multiple datasets simultaneously with this integration.
Metadata
Providing transparency with additional information within our maps to provide you with a better understanding of the influencing factors that may impact the certainty of flood risks, across all flood perils.
About Fathom’s US Flood Map Scientifically validated, large-scale flood mapping, with local-scale precision
Fathom’s specializes in building locally relevant, physically based models of the entire world. This is made possible through the generation of highly detailed and niche geospatial datasets that, when combined, begin to simulate the real-world dynamics of water across the earth’s surface. Of these datasets, the most impactful is terrain.
In developing US Flood Map, Fathom’s engineers have compiled the most accurate digital terrain model of the United States – FABDEM+. It consists of up-to-date LiDAR data, with new LiDAR for all of Texas and extensive improvements across Florida. This has been blended with the cutting-edge FABDEM terrain dataset, in areas where higher-quality local terrain data are unavailable. The result is a consistent dataset for the entire country that can be deployed by geospatial teams, engineers, cat modelers and digital platforms across a wide range of use cases, including flood mapping.
Alongside state-of-the-art terrain, Fathom’s US Flood Map also benefits from advanced present-day and future climate state representation. The map does not base its present day view on historical observations alone, but rather adapts estimates from global climate model ensembles to represent the impacts of climate on water risk – alongside how exposure to climate may differ under various scenarios.
For the end user, this provides the first fully-flexible framework for climate change – Climate Dynamics. This empowers asset managers, consulting engineers, insurers and investors to make informed decisions and effectively manage large portfolios, investments and assets for any location across the Conterminous US, Puerto Rico and Hawaii. The framework can be customized against emission scenarios, time horizons or temperature changes, at ~10 meter resolution.
Extensive validation and analysis has also been undertaken on US Flood Map though our work with the Iowa Flood Center. It has found that Fathom’s US Flood Map strongly correlates with maps from the Iowa Flood Center, offering national-scale flood mapping within real-world error. Learn more about our US Flood Map validation.
Learn how we build physically based models by exploring our Product Stack.

On-demand webinar: The science, methods and data behind Fathom’s cutting-edge US Flood Map
Watch our recent webinar available on-demand, where we present a technical deep dive into the science, methods & the latest observation, terrain & climate data driving the map.
01 US Flood Map supplements FEMA data where it is outdated or missing
In a report (2021) from the Association of Statewide Floodplain Managers (ASFPM), the body estimated that a startling 66% of the 3.5 million stream miles in the United States are yet to be mapped by FEMA. This proves challenging for statewide flood planners, risk managers and engineers needing to gain a complete picture of flood risk across large areas.
Fathom’s US Flood Map serves as a cost-effective and efficient tool, that can supplement data that is incomplete or outdated. Not only is US Flood Map underpinned by the most accurate terrain dataset for the US, but it also represents every river channel, irrespective of size, including even the smallest of flow pathways.
Recently, the Texas Water Development Board delivered the first-ever state-wide flood planning program for the State of Texas, using Fathom’s US Flood Map. Learn more.
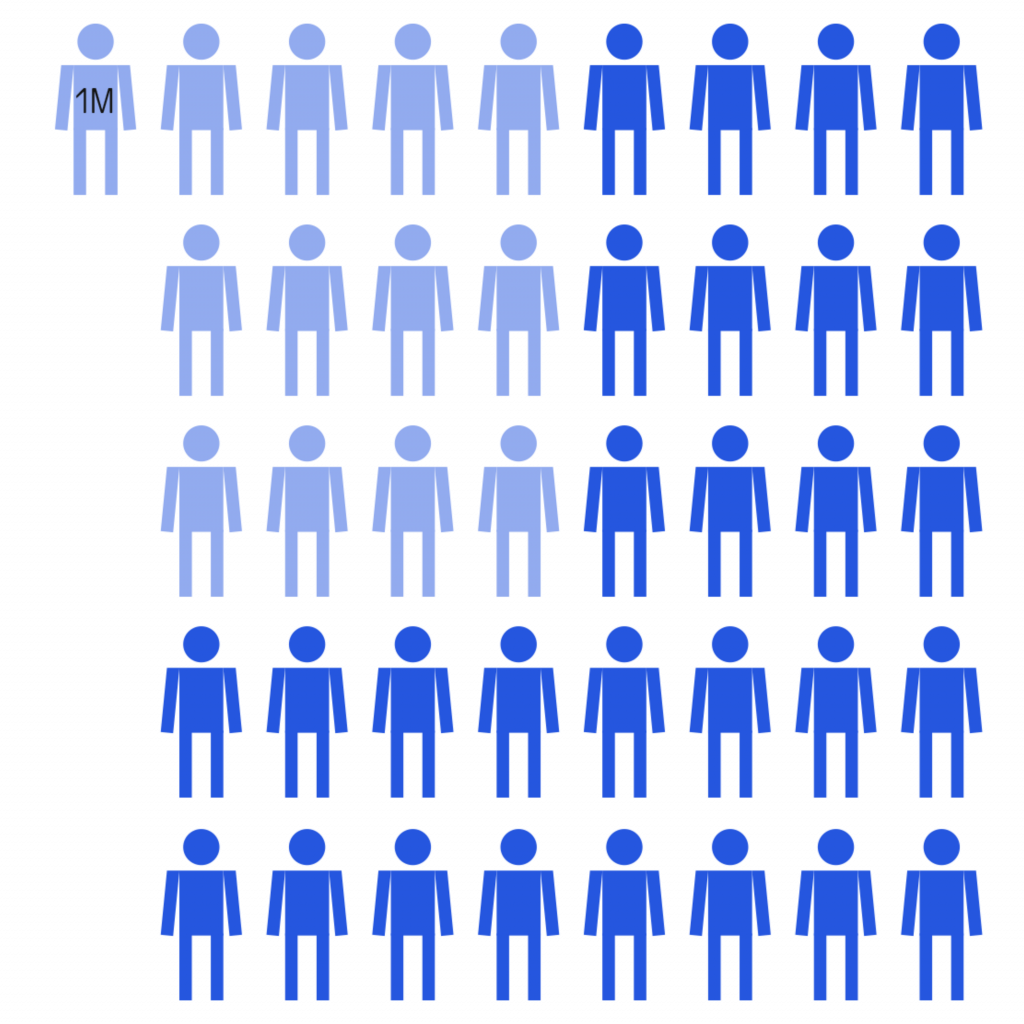
02 Government bodies are currently underestimating US flood exposure threefold
FEMA has identified 13 million Americans living within areas at high risk of exposure to the 1-in-100 year flood (light blue).
In contrast, Fathom’s model has identified 41 million Americans exposed to 1-in-100 year flood (dark blue).
Research conducted in collaboration with Bradt and Kousky (2021) found that voluntary insurance purchases are preferentially taking place in areas where Fathom’s model deviates from FEMA flood maps. This implies that our model is correctly identifying areas of risk which FEMA’s model misses. Download the paper here.
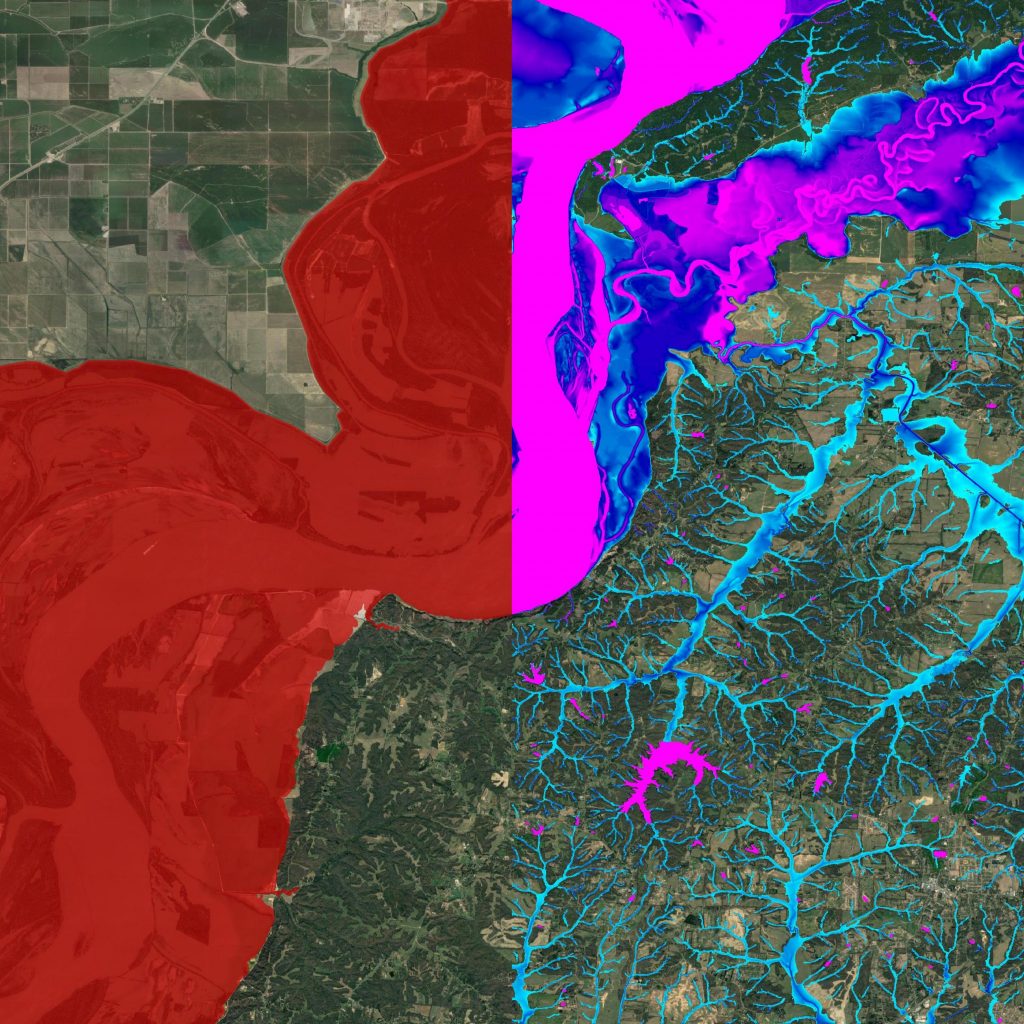
03 Fathom’s US Flood Map compares well against local models
Building on an array of scientifically robust and peer-reviewed research, Fathom has developed a range of AI and ML approaches that allow us to map flood hazard at large-scale.
These methodologies have been independently validated by organizations like USACE, who found similar levels of error between local and Fathom hazard maps. You can read USACE’s full evaluation here.
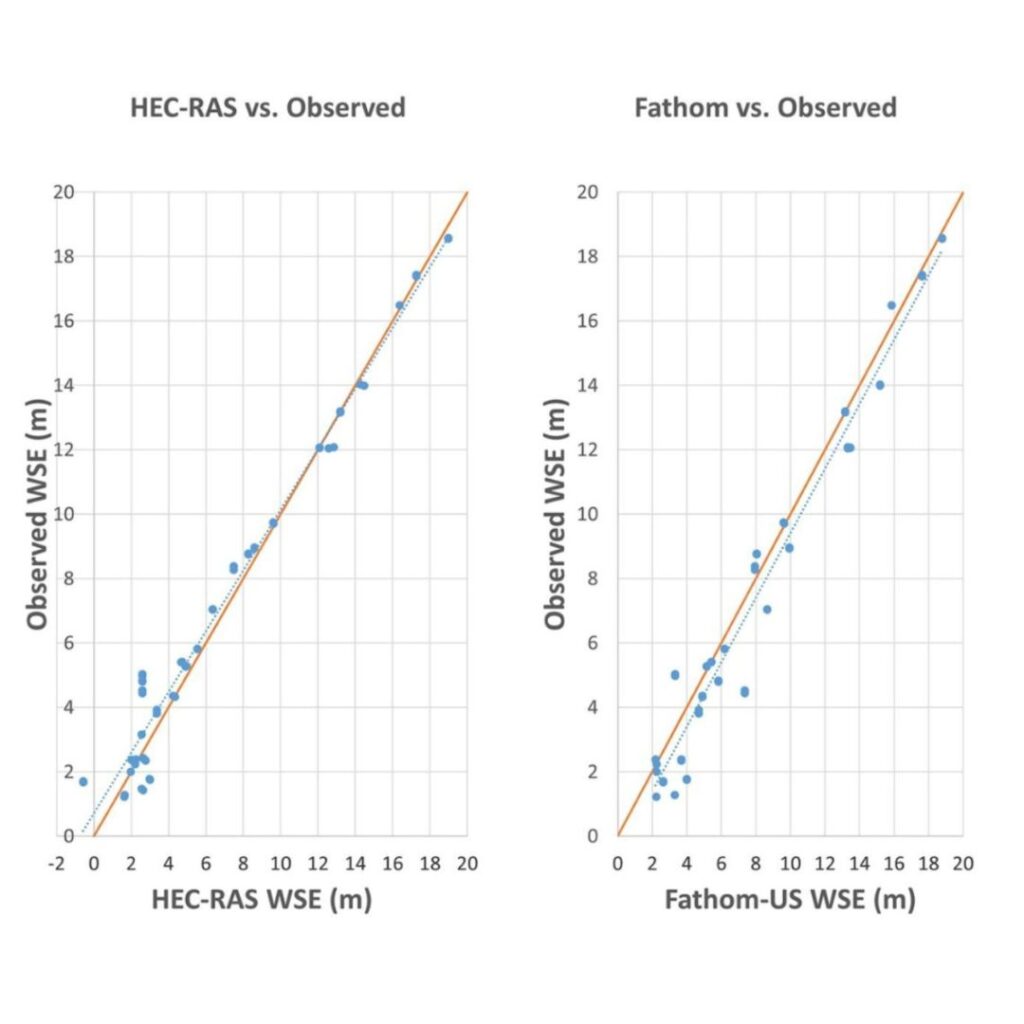
To a similar affect, validation work undertaken against the Iowa Flood Center’s local maps identified strong correlation between the two maps. In both urban and rural areas, Fathom’s US Flood Map was found to be within error of a real-world flood event.
Learn how Fathom validated its US Flood Map against the Iowa Flood Center local models.
How to access Fathom’s US Flood Map
Fathom API

Fathom’s API is a cloud-based solution for data provision that enables users to access Fathom data on-demand directly through this functionality.
Fathom Portal

Fathom’s portal is an interactive platform that enables users to host, view and analyse data, without the need for an in-house platform solution.
Direct provision

Request to host the entire of the US Flood Map or cut out a state, county or district to be provided directly as a GeoTIFF file.
Partners

Fathom data is available through a range of partners, learn more about the platforms through which you can access Fathom data.