Validation is a crucial step for any data provider. Here’s why.
In 2023, we released the latest iteration of our US Flood Map. We built this dataset out of our Global Flood Map; it offers comprehensive, climate-driven flood hazard information like its global counterpart, but with enriched regional data and more defense information and observational records for each state of the contiguous US.
We have extensively validated this map in all its iterations – an essential step to demonstrate its strengths and limitations and assure full confidence and transparency in our data, models and mapping. We co-authored the first validation studies with the Iowa Flood Center in 2019 and 2020. These studies were published in world-leading open-source journals, and are available for free on our website.
After we launched the latest iteration of our map last year, we again worked with the Iowa Flood Center to update our analysis and validation. The results? That Fathom’s US Flood Map agrees and strongly correlates with maps from the Iowa Flood Center, offering national-scale flood mapping within real-world error.
Explore the article to learn more about:
- What did we find and why does validation matter?
- About the Iowa Flood Center
- Fathom’s work with the Iowa Flood Center
- Validating Fathom’s US Flood Map
- Why validation matters
Let’s dig deeper: what did we find, and why does validation matter?
First up: Meet Fathom’s US Flood Map
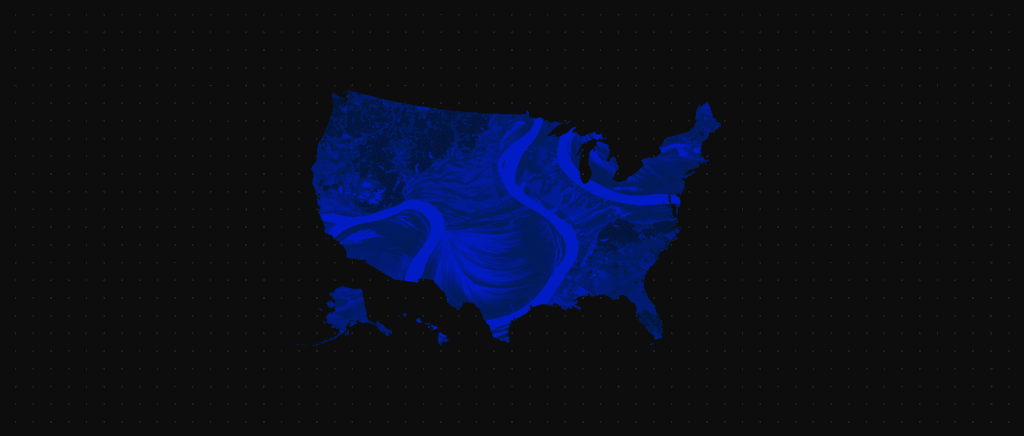
Our US Flood Map utilizes cutting-edge data to offer comprehensive and climate-driven flood risk information across river, surface and coastal perils. It covers every river, stream and coastline of the US, and all climate scenarios and time horizons. It offers complete coverage of the contiguous US, Puerto Rico and Hawaii at a resolution of approximately 10 meters, and models the impact of climate change on global flooding across a range of plausible futures (via our Climate Dynamics framework).
One of the map’s key differentiators is its use of terrain. Underpinned by Fathom’s cutting-edge Global Terrain Data – FABDEM+, US Flood Map blends FABDEM with a large library of LiDAR data. This update increased our coverage of high-accuracy terrain data across the contiguous United States, with twice as much LiDAR as was available before; LiDAR now covers 79% of the land area and 95% of occupied structures. This data also considers the influence of dams and other land-use impacts, and represents river channels and catchments using a novel method to dynamically simulate river size, geometry and flow (known as Channel Solver).
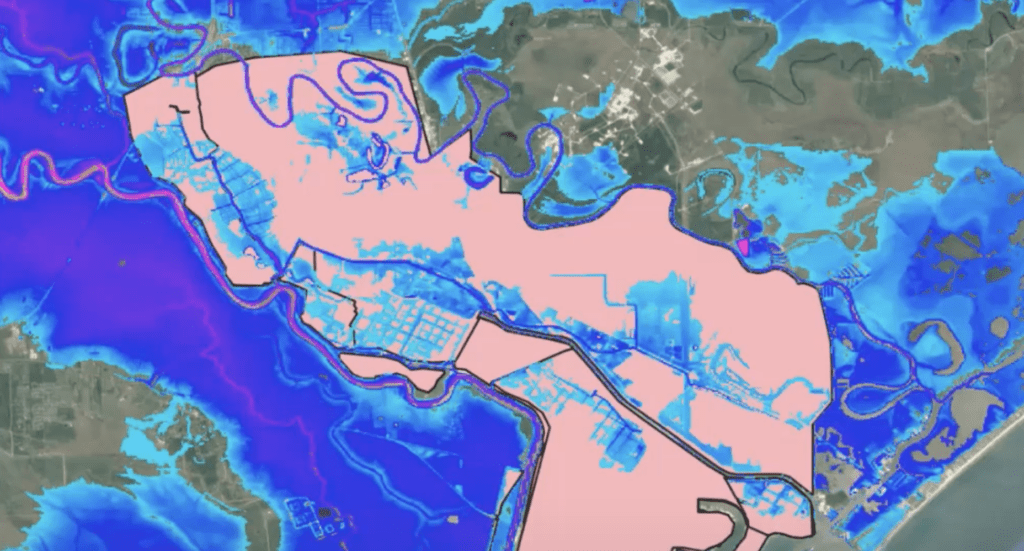
Present day, 1-in-200 year fluvial flood event in Memphis
In short, it’s the most complete and technologically advanced countrywide US map available for risk assessment and decision-making. It allows any user to consider not only current flood risk at a given location, but also how this might evolve in the future. This is essential for engineers to effectively manage their exposure to flood risk in the US and avoid the unpredicted and financially devastating flood events that are becoming ever-more extreme.
Such mapping supports all kinds of applications and professions. For example, architects, engineers and consultancies can quickly access the reliable off-the-shelf data they need throughout the tendering process. Floodplain managers can gain insight into how large-scale flood maps compare to local models – including how accurate they are, and any limitations they may have. Policymakers and insurers can optimize their work in risk management and disaster preparedness. And risk managers can explore the full array of risks posed to their business, and gain awareness of potential financial losses that may come their way.
The Iowa Flood Center
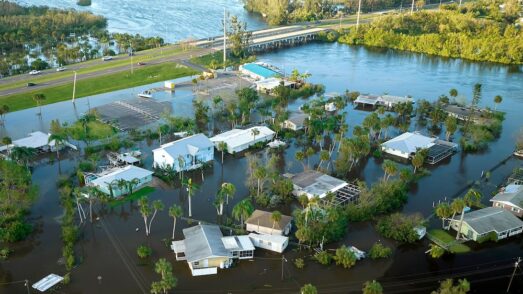
In 2008, flooding devastated eastern Iowa. In response, state legislators established the Iowa Flood Center – the country’s only academic research center solely dedicated to flooding. The Iowa Flood Center has since established itself as the go-to institution for flood information and research in the state, providing comprehensive, high-quality mapping at city and statewide scales.
The Center operates a flood information and alert system to provide real-time guidance on watersheds, precipitation and stream levels for Iowa communities, and has deployed a statewide system of stream sensors, weather stations and rain gauges to capture a broad range of weather metrics. Through its activities and data provision, the Iowa Flood Center is improving flood prediction, drought assessment, and water resource, watershed and agricultural management in the state, with its flood forecasting and mapping showing “the probability, extent, and depth of flooding for every Iowa stream draining more than one square mile”.
Thanks to the availability and quality of Iowa Flood Center data, their maps have served as an invaluable testbed for the comparison and validation of our US hazard data. Our work has typically focused on comparing their high-quality modeling to our own outputs, finding that the two datasets generally agree – with only some locally significant differences and within error bounds that are immensely difficult to remove.
A new automated method for improved flood defense representation in large-scale hydraulic models
In 2019, we worked with Iowa Flood Center researchers to improve the accuracy of flood inundation modeling. Typically, digital elevation models (DEMs) – models that represent bare-earth topography – use coarse terrain data, and end up being oversimplified and artificially smooth as a result. This doesn’t adequately capture structures that may defend against flooding, limiting accuracy. Our research explored a novel automated method that could preserve the elevation of such structures, with good agreement with Iowa Flood Center data.
Combined modeling of US fluvial, pluvial, and coastal flood hazard under current and future climates
In 2020, we again worked with the Iowa Flood Center team to produce comprehensive and consistent projections under both current and future conditions for pluvial, fluvial and coastal flooding in the US. We reported a new and significantly enhanced analysis of US flood hazard at 30-meter resolution. The study used better hydrography data, new methods to determine channel depth, and more rigorous flood frequency analysis, also downscaling outputs to property tract level and including the impact of local interventions in the flooding system. The result was the first national-scale analysis of flood hazard for the contiguous US under current and future conditions, and was validated against Iowa Flood Center data.
Validating Fathom’s US Flood Map
Step one: Data
Our US Flood Map uses a top-down approach, incorporating global elevation data from sources including LiDAR and satellite imagery. The map includes a wide array of input datasets, spanning from foundational layers such as elevation data, channel solver and boundary conditions all the way to urban drainage, defenses, and our Climate Dynamics framework. The Iowa Flood Center’s high-quality and high-fidelity models focus on specific urban areas and employ physical simulations based on hydraulic modeling. They consider aspects like river channel geometry, flood defenses, and urban drainage systems.
Step two: Methodology
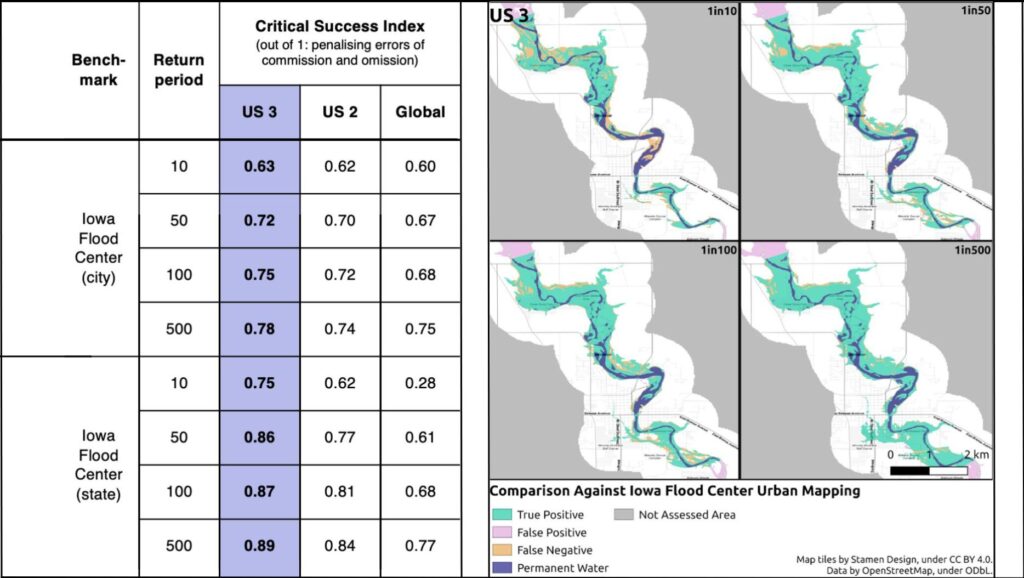
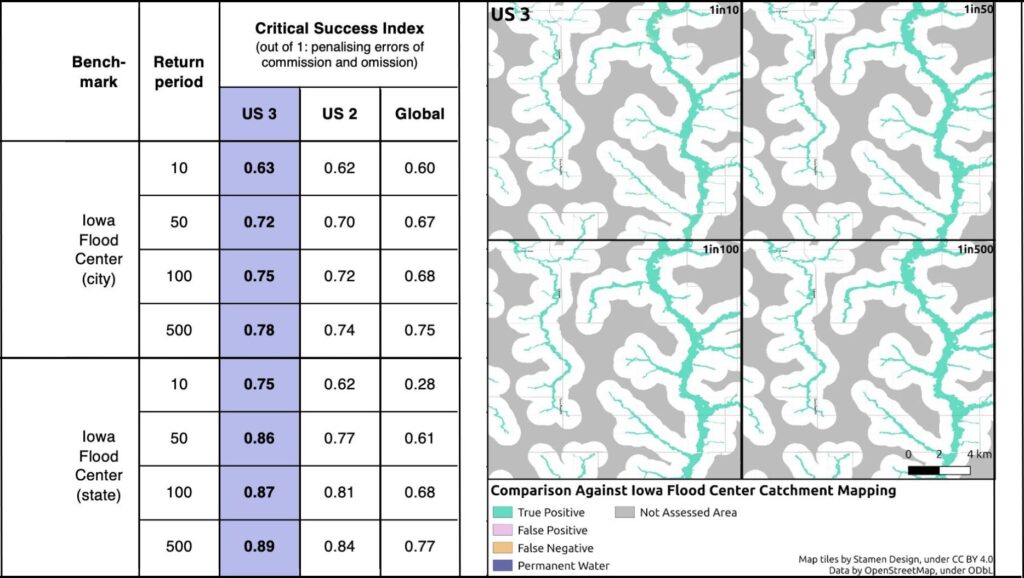
We compared the flood inundation areas predicted in our US Flood Map with the simulated flood extents from Iowa Flood Center models for several representative cities across the US. The Critical Success Index (CSI) was the primary metric used to assess agreement between the two datasets. This index considers both hits (correctly predicted flooded areas) and misses (failing to predict actual flooding) while penalizing overpredictions (incorrectly predicting flooding where it doesn’t occur). We compared CSI scores across cities and flood scenarios, investigating the influence of factors such as terrain complexity and data resolution.
Step three: Results
While there are some local differences, especially in areas with complex terrain or where city-scale models have more detailed information, Fathom’s US Flood Map agrees well and strongly correlates with maps from the Iowa Flood Center, with CSI scores indicating good performance. The validation results show that our top-down approach can be accurate enough for national-scale flood mapping even when compared to detailed local models, and produces flood risk information within the error of a real-world event.
Explore our toolkit ‘Questions to ask your flood modelers’
Gain an understanding around the questions and answers you should be exploring with your vendor to avoid overconfidence in flood inundation modeling and ask searching questions of your flood data provider.
Validation is not an extra or optional step when producing risk models. It’s an essential part of producing these models and proving them fit for purpose.
Validation demonstrates the strengths, limitations, validity and veracity of a model
How can we make confident decisions using data that hasn’t been scrutinized? We must understand the strengths and weaknesses of our models to ensure they’re valid and true, and to better comprehend which model is the best fit for a given purpose (whether that be floodplain mapping, climate change adaptation, disaster preparedness or risk management).
Validation eliminates model drift
Environments and behavior change constantly. We need to monitor how models are capturing real-world factors that can affect flood patterns – such as changes in land use or infrastructure – to assure their continuing predictive power.
Validation identifies errors and biases in a model’s design, data or training
To improve the overall quality and fairness of our maps, we must understand their biases. A good example of this is research comparing Fathom’s modeling to that of Base Level Engineering (BLE). This revealed that local-scale BLE models, often produced by engineers, are often biased to be slightly drier than real-world observations, whereas Fathom’s models are biased to be slightly wetter. Neither is necessarily a negative trait – but knowing this improves our ability to effectively analyze and use these data accurately.
Validation avoids an insular or static approach to flood modeling
Different modeling approaches can produce wildly different outcomes. Fathom advocates a multi-model approach to flood risk analysis, as using data from multiple trusted, transparent sources can reduce the uncertainty in your flood modeling. This is why our Climate Dynamics framework, something that underpins the US Flood Map, incorporates an ensemble of climate models to represent uncertainty in various global warming levels and emission scenarios. This ensures that we’re not using one static representation of the future. Read more about how we built the Climate Dynamics framework.
And, crucially, validation builds trust and confidence by promoting openness and transparency
Validation turns a model from a black box into a tool that can be relied upon to make trusted, informed decisions. It benchmarks a model against another reputable source and is an integral part of our continued commitment to exposing the methodologies and inputs driving all of our models. All validation work is published in open, peer-reviewed journals. By promoting transparency, communication, and a critical approach, we’re working to reduce uncertainty in flood modeling. We aim to support users to make informed decisions that protect lives, assets and incomes, and build flood-resilient communities across the globe.
Watch our webinar on ‘Understanding and managing flood risk uncertainty’
As identified in this article, there are a number of inherent uncertainties present in flood modeling. How can we decode these uncertainties to allow for better decision-making?