Exploring the challenges and methodologies behind developing Fathom’s flexible framework to model the impact of climate change on global pluvial, fluvial, and coastal flooding.
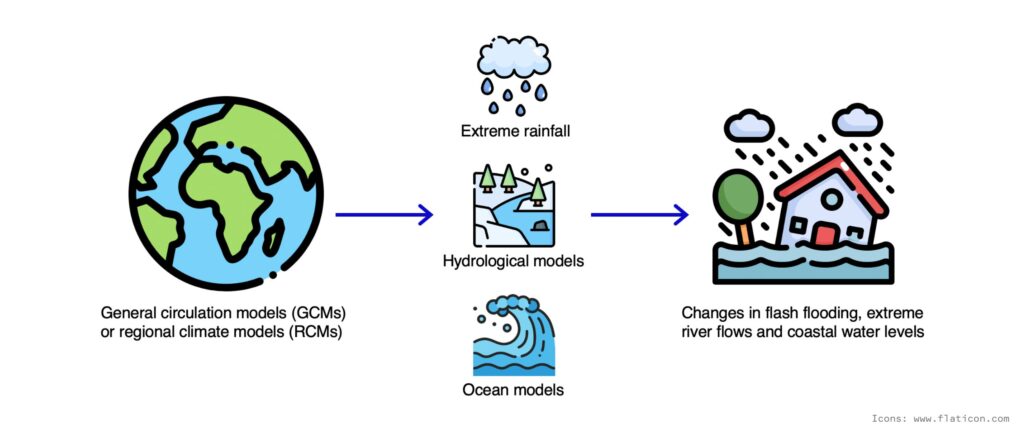
Attempts to map the generalities of climate models onto the specifics of flood risk have historically proved challenging. Most have used an application technique to chart the output of one or more climate models onto an existing flood model. Such techniques include:
- regional modeling, which nests a higher-resolution climate model covering a smaller domain within a coarser-resolution global climate model;
- correction/adjustment, which may involve downscaling the output of a coarse-resolution climate model and/or bias correction using observational data; or
- the calculation of change factors for specific variables which are then used to adjust the outputs of an existing observation-based model.
Each of these application techniques has strengths and limitations, including being limited by the processes that they represent and the scales (temporal and spatial) that they operate on.
In this insight we explore how we built the Climate Dynamics within our Global Flood Map, the challenges involved with building a flexible climate framework for the whole world, and what this means for professionals using the tool to build their own view of risk.
Addressing uncertainty in future flood projections – A viable solution
A viable solution must consider how different time horizons and emissions scenarios will drive results. It must apply to all forms of flooding and provide a high degree of geographical granularity, but be applicable globally. To account for the inevitable multi-layered uncertainties associated with projecting future climate, Fathom has designed its climate change capabilities to be as flexible as possible. Given that we cannot predict what future pathway we will follow, the Climate Dynamics framework allows users to address this uncertainty by looking at all ends of the spectrum.
This is done by applying a range of future changes in climate to flood model outputs, enabling Fathom to produce climate-conditioned hazard data for fluvial, pluvial, and coastal flooding for any sensible future emissions scenario anywhere in the world at 30 meter resolution.
Multi-model inputs
We’ve used data from multiple global climate, hydrological and sea level models to help understand how variables like extreme precipitation and peak flow may change over time under different levels of warming. Between them, these models include atmospheric, oceanic, and land-surface processes, and we use them to try to ensure that as many potential flood-influencing processes are represented as possible. This is in contrast to a more simplistic approach, such as applying a single scaling factor to extreme precipitation globally based on the Clausius Clapeyron relationship (for every 1°C increase in temperature, the air can hold an extra 7% of moisture). The result is a climate-adjusted, multi-peril flood model which delivers a physically consistent, global view of how climate change might affect floods around the globe between 2020 and the year 2100.
As well as this, our team of scientists have undertaken temporal and spatial smoothing of the climate data, to reduce the impacts of internal climate variability and try to extract the forced climate change signal.
Change factor approach
A change-factor approach lies at the heart of the framework, we increase confidence in our future projections through the use of outputs from multiple climate and hydrological models. In short, we have calculated the relative changes which the models forecast and used them to update our historical baseline data.
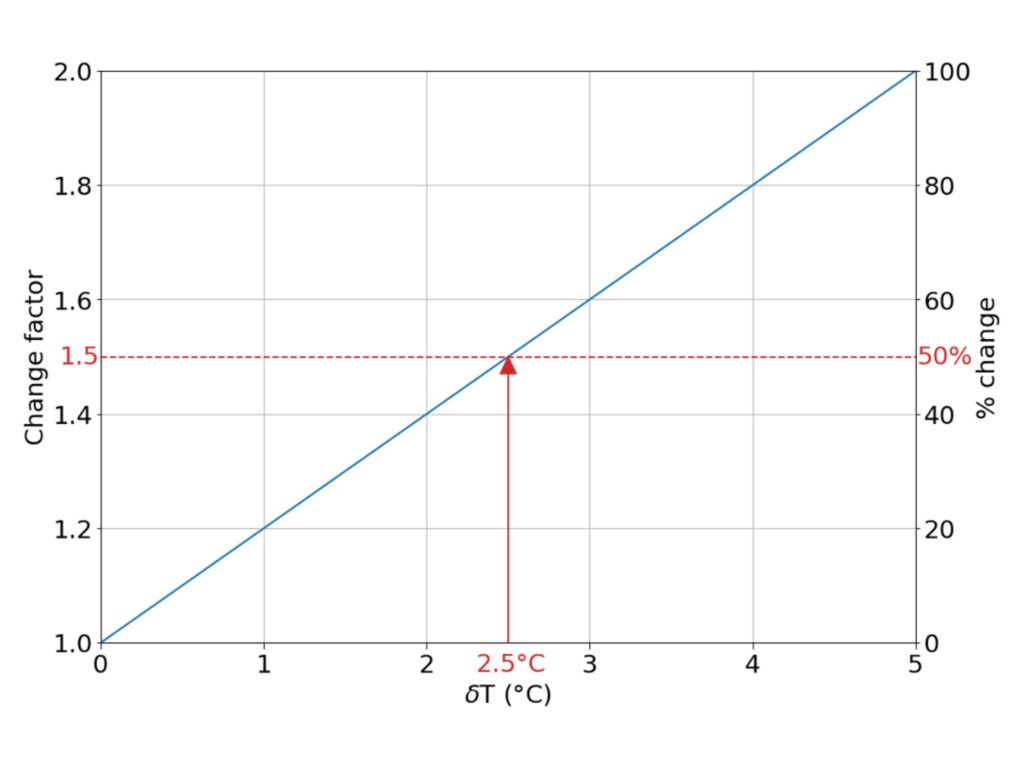
Our change factor is the relative change in a variable, per degree of warming. Warming is stated in terms of Global Warming Levels (GWLs), which represents the change in global mean annual temperature compared to pre-industrial – for example, today, we’re at a GWL of approximately 1.2°C. We use climate model data to calculate changes for different flood-influencing variables, such as extreme rainfall, at different global warming levels. We then apply the change factors to the baseline data to produce projections for these variables for future climates. This approach permits us to apply relatively coarse-resolution climate model outputs to our high-resolution flood maps to produce climate-conditioned future flood maps.
For pluvial change factors, for example, we use data from four bias-corrected global climate models. We take the median and upper and lower quantiles of the multi-model ensemble of extreme precipitation change factors, allowing us to estimate the uncertainty in the projections of future climate changes. In a very few areas, low model agreement is observed, where the models show diverging trends in extreme precipitation change, but generally most regions are projected to experience an increase in extreme precipitation in the climate models. By mapping the global extreme precipitation change factors, we can clearly see the spatial variability in the projected increasing rainfall intensities across most regions.
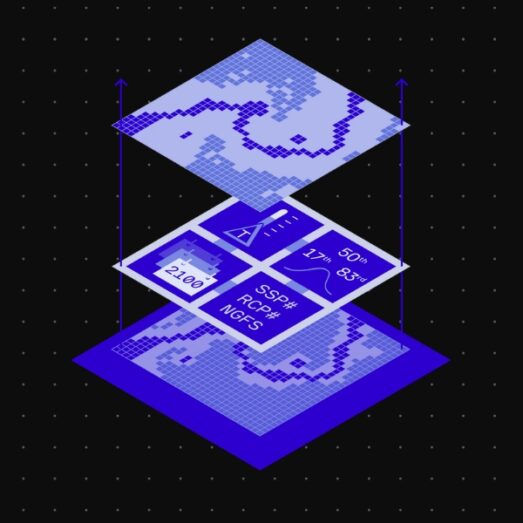
Users are able to produce flood maps for any sensible combination of future year and climate scenario (an IPCC’s SSP pathway, one of six from the Network for Greening the Financial System used by central banks, or others), or for any year to 2100 and level of warming between 1 and 5 degrees (again with the caveat that they must be realistic combinations). We are happy to consult on which scenarios or warming ranges would be most appropriate based on each client’s use case. We explicitly present climate model uncertainty within the framework, and always provide the median and the “likely” range of outcomes – the latter based on the IPCC’s definition (represented by the central 66% of the distribution), so the 17th and 83rd percentiles.
Fathom Climate Dynamics framework
Our Climate Dynamics framework is a well-considered approach with completely transparent methodologies. The feature allows the user to interrogate and understand certain modeling assumptions to deliver their an own-view of risk. The framework was developed with a deliberate emphasis on uncertainties surrounding future hazard. Using multiple models and temporal and spatial smoothing reduces the uncertainty inherent in climate change signals, and therefore increases confidence in the ultimate future projections.
The Fathom approach yields a globally consistent view of how climate and flooding may change in the future. It lets us translate changes in the metrics produced by climate models to changes in flood hazard, whilst removing or reducing the relevant biases. It allows us to produce climate-change flood maps for a range of time periods, warming levels, and emissions scenarios. The distribution of change factors for each location for each peril allows us to calculate a distribution for each flood metric, thus capturing the uncertainties associated with the future projection.
Fathom’s Climate Dynamics framework is an immensely valuable tool for the assessment of climate-change impacts on flood risk in a globally consistent way.
If you would like to speak to one of our climate scientists about the framework and its application in more detail please get in touch with our team.

Find out more about our Global Flood Map and how it can support your understanding of flood risk
Our Climate Dynamics framework is a part of Fathom’s Global Flood Map. The first global flood map to provide risk professionals with all perils and climate options.