
In this article, we examine how we can we use emerging technology to support flood plain management and risk prioritisation across whole cities and states.
Last year, Fathom was invited to ASFPM 2022 where we presented on large- scale flood modeling, and how it can be used to assess flood risk at a city or state-wide scale.
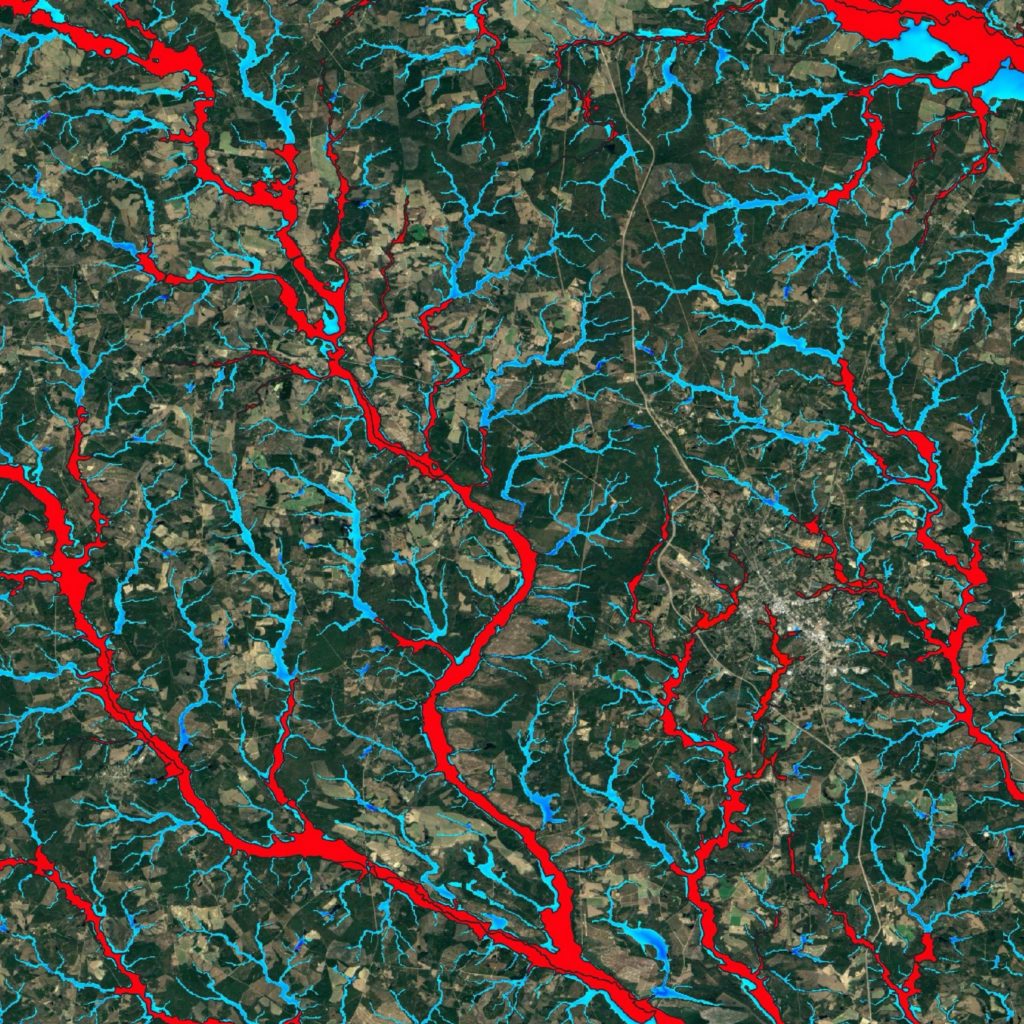
We discussed how large-scale flood maps can help engineers and floodplain managers understand flood risk in areas of data scarcity, and also how it can help supplement some of the high resolution flood data that’s already available.
The last 25 years have seen a lot of improvements to flood modeling techniques, largely due to huge increases in computer processing power. Over a relatively short period of time, more detailed, complex models covering larger areas have become within reach.
The importance of large-scale flood mapping
So, why does it matter? Why is large-scale modeling important? Many floodplain managers deal primarily with small-scale mapping, based on a specific area. However, the most costly and damaging flood events often have a state level, or even a regional scale footprint; to fully understand the risks these events present, the entire area of impact needs to be assessed.
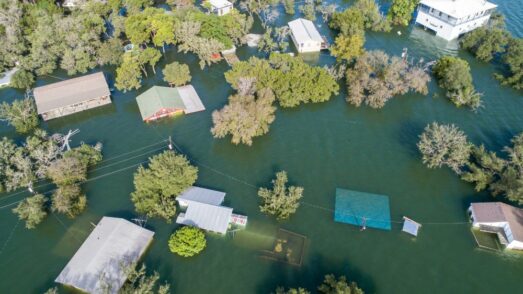
For example, in 2021, there were huge floods in Europe that stretched across Belgium, Germany, the Netherlands and Switzerland. In the US, the most costly flood event on record was Hurricane Harvey in August 2017 which hit Texas and Louisiana. For floodplain managers who are analyzing and planning asset resilience, large- scale models can allow you to get a view of flood risk over larger areas without having to build very detailed models . Providing this data for both current and future climate scenarios enables you to understand what is likely to be required to provide longer term resilience.
What to consider when building global-scale flood models
Challenges and considerations
So what are the challenges and considerations when you’re building these large-scale models? Firstly, elevation data is key, especially when you’re looking at two dimensional models of flow. Another challenge lies in understanding the quality of the data you’re working with, and what to do when data is missing.
Webinar: Underestimations of US flood risk
Sophisticated computational modeling is being developed at large scale, accelerating our understanding of US flood risk. In this webinar, we examine the latest in US flood mapping and explore how water specialists can benefit from this technology.
An on-going challenge for floodplain managers is the fast-moving developments in research, especially around climate change. When working in the field of flooding , you cannot just be interested in what’s happening now, but also what is likely to happen in the future. As a result, at Fathom, the flood data that we generate is regularly re-generated using the latest science and newly available data. Currently the maps and models are updated approximately every 18 months.
Large-scale flood mapping in practice
To really understand both the application and impact of large-scale flood mapping, it’s useful to look at an example of large-scale modeling in practice – in this case, in Texas.
In 2019, the Texas Legislature tasked the Texas Water Development Board (TWDB) with delivering the first-ever state-wide flood planning programme for the State of Texas. To accomplish this, the TWDB gathered together their existing flood related data into a Flood Planning Data Hub. However, there were significant gaps, as 63 counties within Texas didn’t have any existing flood maps, and much of the rest of the data was outdated.
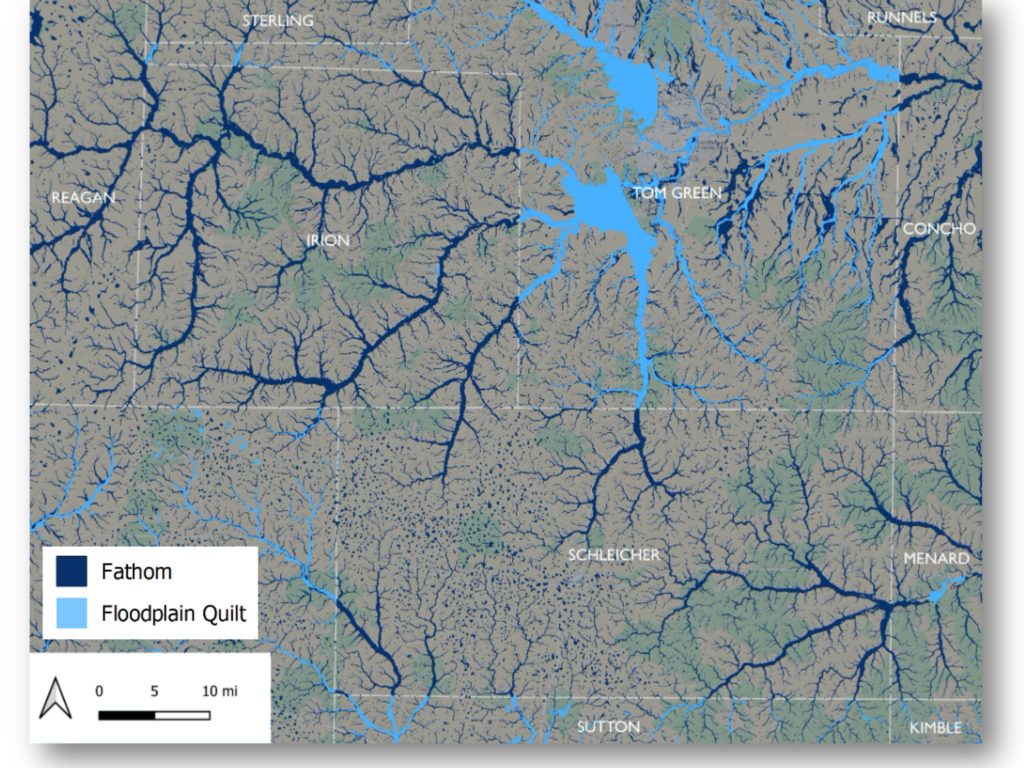
Where regional flood data was outdated or unavailable the TWDB incorporated Fathom’s US Flood Map into a floodplain quilt layer to provide a statewide rapid assessment flood inundation layer that can be used by floodplain managers until BLE (base level engineering) can be completed.
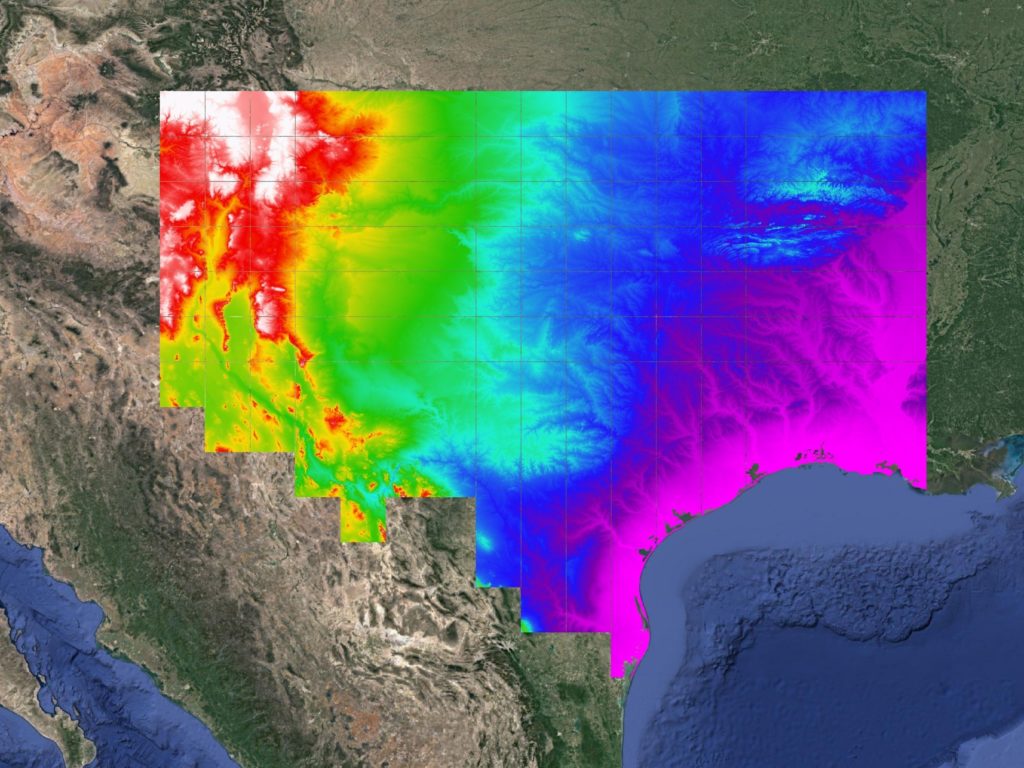
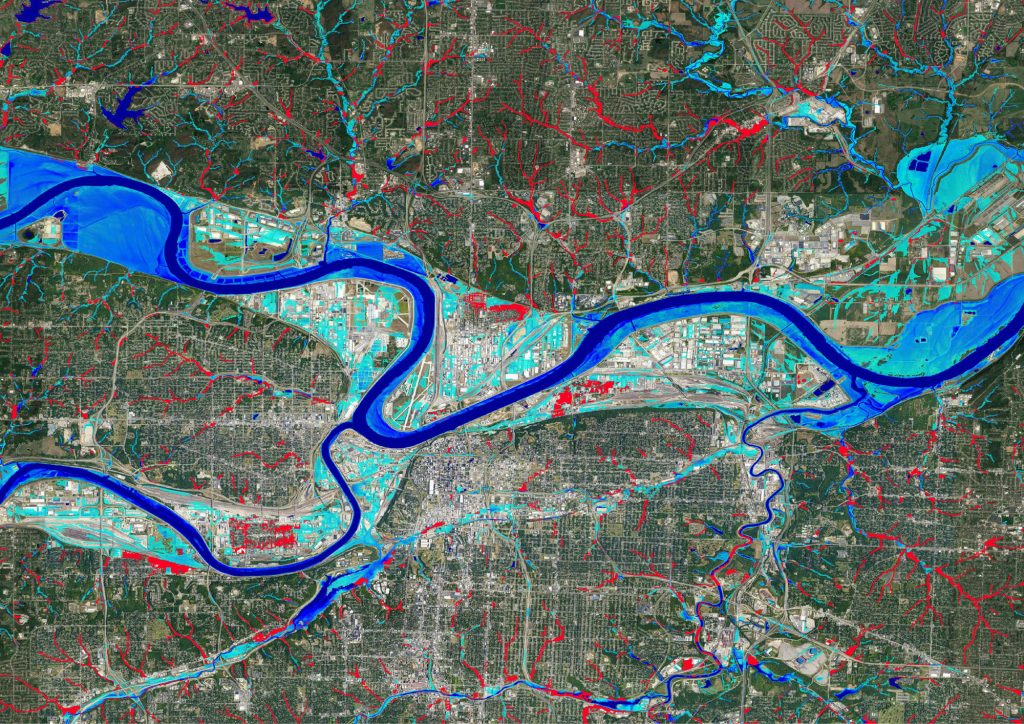
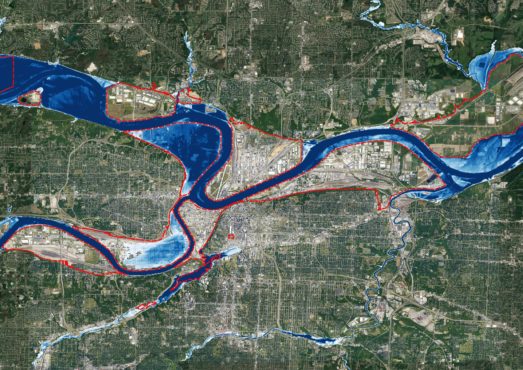
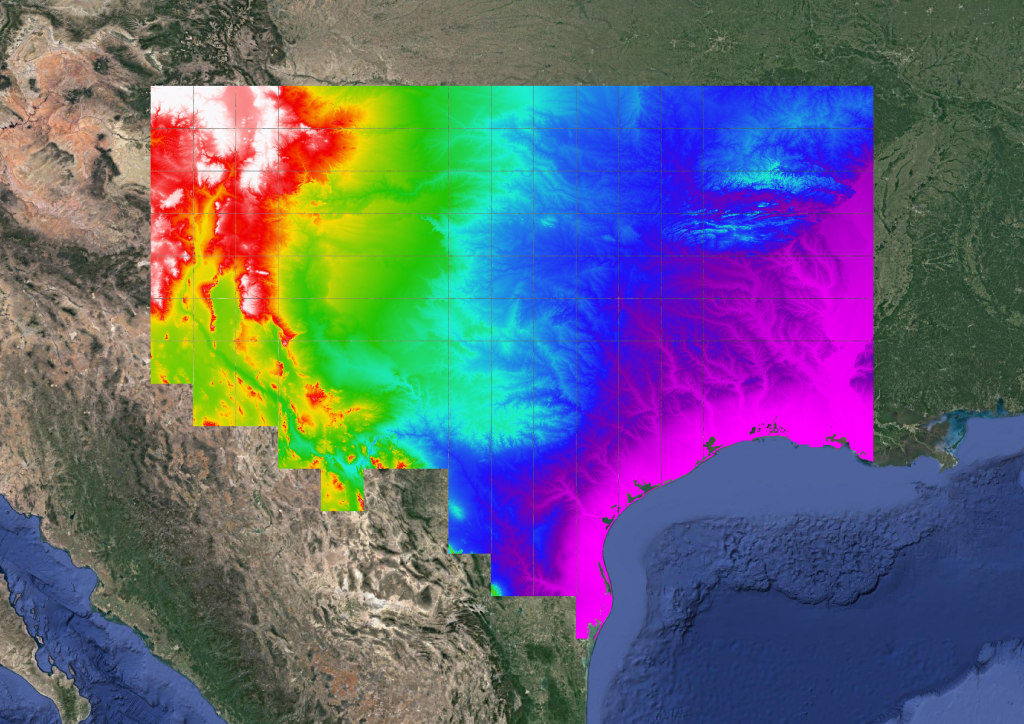
In addition to this, the water board required Fathom to create ~10ft Digital Elevation Model (DEM) of the entire state, built using over 300,000 individual laser altimeter datasets (LiDAR). This elevation dataset was then used as a foundation for Fathom’s hydraulic model to be re-run through, with the hydraulics computed at ~100ft.
These results were downscaled to ~10ft resolution, providing an output of flood depths for pluvial, fluvial, and coastal flooding at four different frequencies: 1 in 5 (20% chance in a given year), 1-in-10 (10%), 1-in-100 (1%), and 1-in-500 (0.2%).
It was only by using large scale flood mapping that TWDB effectively reached their goal of achieving a consistent flood risk layer for the entire State of Texas at a 10ft resolution in just six months, from start to finish.
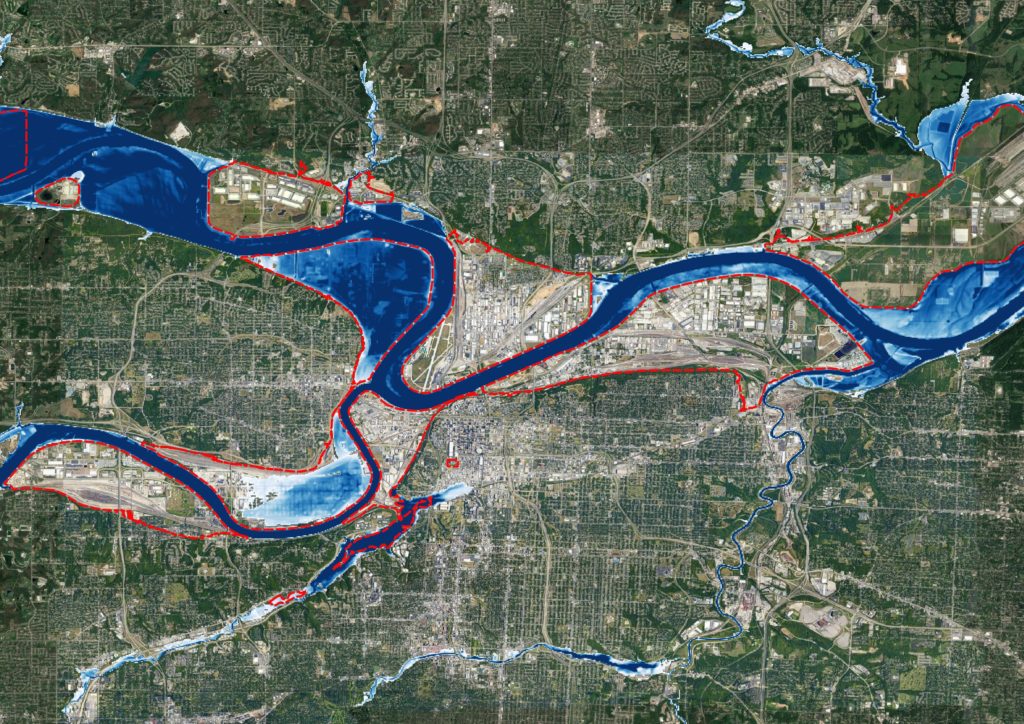
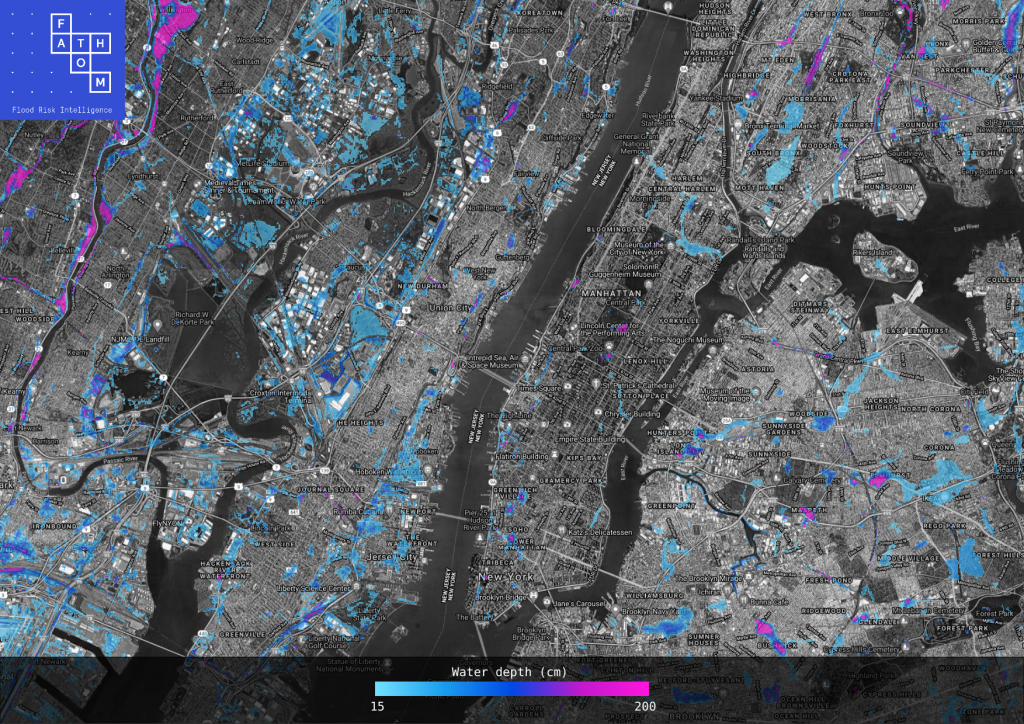
Large-scale flood mapping isn’t just applicable to planning activities on a global scale where data is scarce; even in the US, many cities and states suffer from a lack of adequate data. Using large scale mapping allows floodplain managers an opportunity to see the big picture with a high level of precision, so they can more effectively plan and predict flood activity.
New research: How does Fathom’s US Flood Map compare against local BLE models?
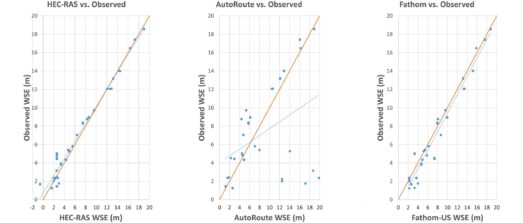
Comparison of estimated flood exposure and consequences generated by different event-based inland flood inundation maps
New research from Gutenson, J. L. and others, including Fathom’s Chief Research Officer Dr Oliver Wing, compares the estimated impact and exposure to flooding generated by different event-based flood inundation maps.