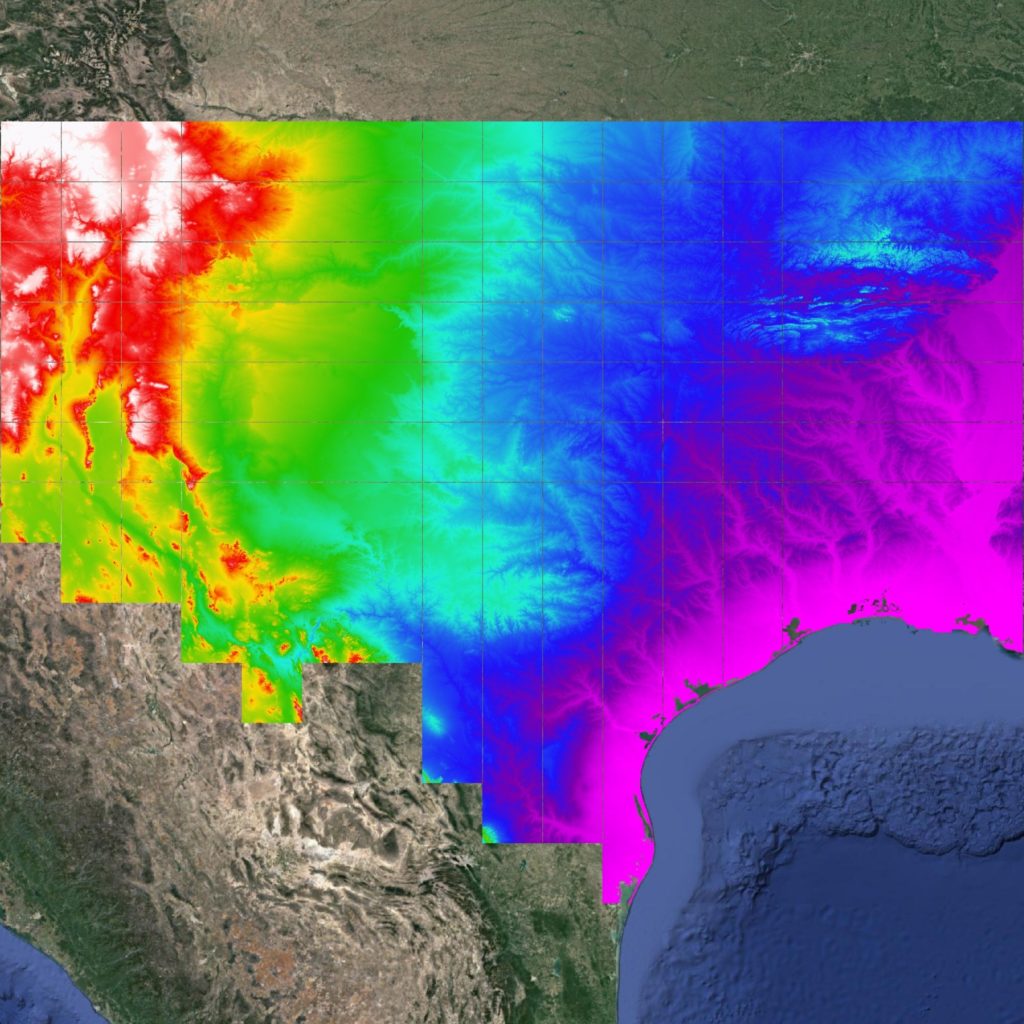
Fathom has mapped every river channel in the US, even where data is inconsistent or missing
Inadequate and missing flood inundation data is a big challenge for floodplain managers, water professionals and engineers
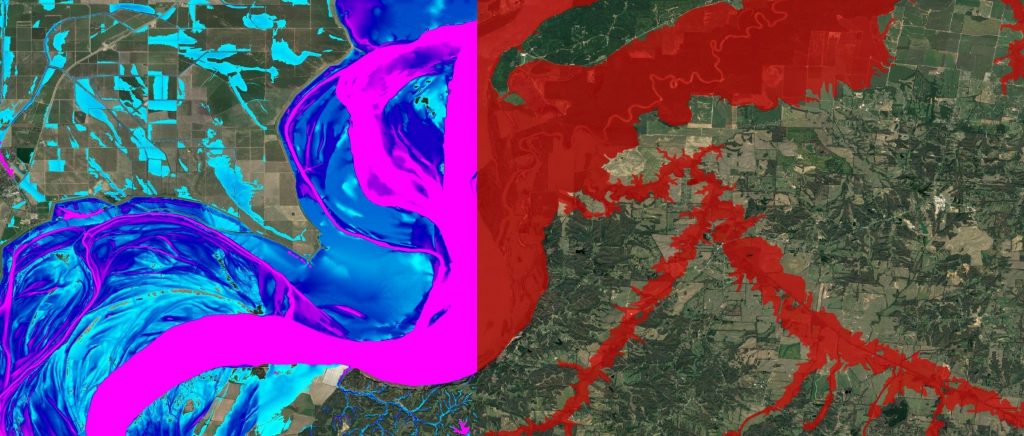
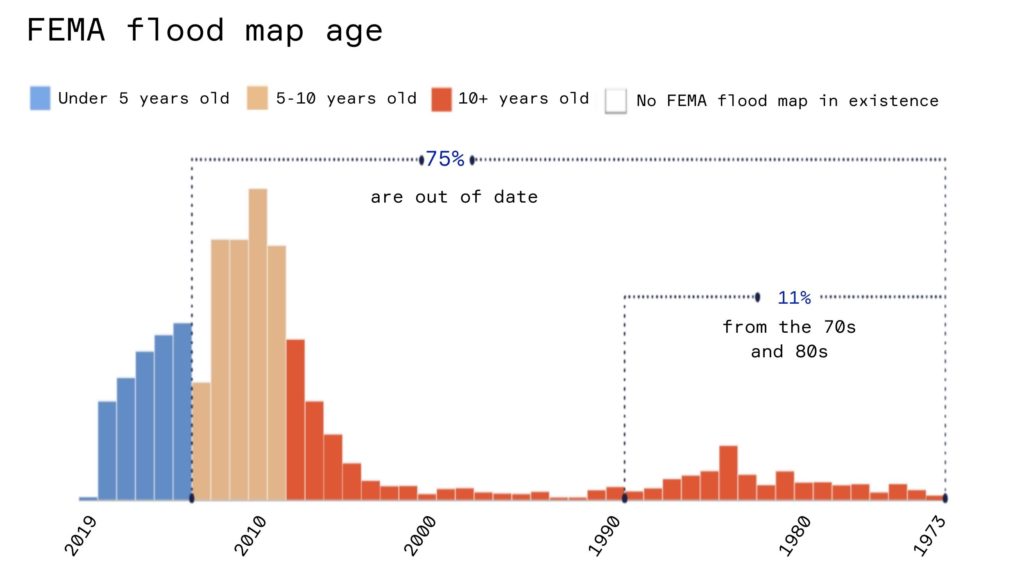
Gaps in existing FEMA flood data
Federal, state and local government organizations have invested billions of dollars in surveying, modeling and mapping flood risk, yet flood hazard mapping is incomplete in most states. FEMA’s flood hazard data is an excellent resource, but is a patchwork of small scale ‘traditional’ flood models that factor in the impact of large river channels but omit smaller channels.
To make matters worse, these models are outdated in many areas, with some built in the 70s and 80s. Today, 75% of these maps are old and 40% of the US remains unmapped.

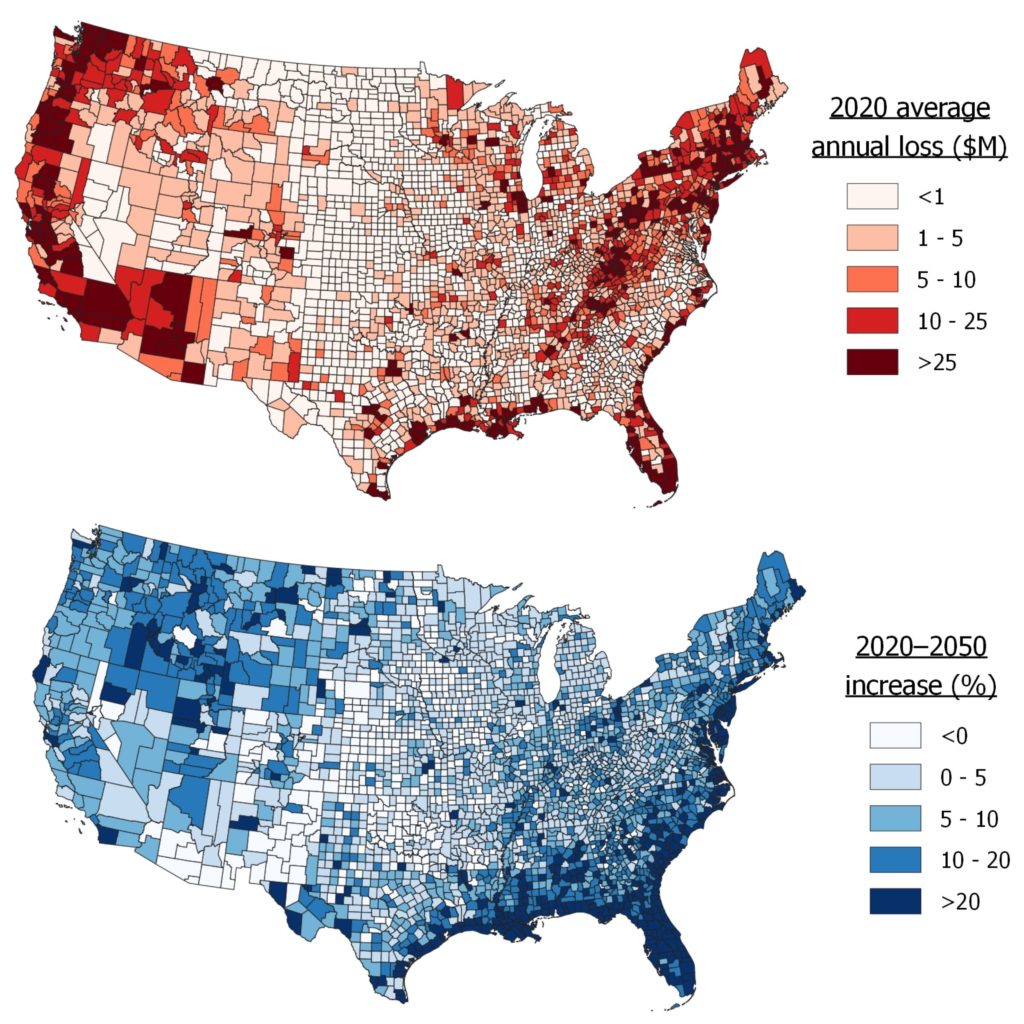
Climate change presents a growing hazard
Climate change is already altering the Earth’s weather patterns, causing more frequent and severe weather events. It can only be addressed by adaptation, not mitigation. The majority of climate change driven flood risk is historical flood risk and our failure to drive that down means we’re already on borrowed time to adapt to the increases.
Our research has found that in the next 30 years there will be a 26% increase in flood damages in the US as a direct result of climate change.
International and US regulators alike, such as the Task Force on Climate-Related Financial Disclosures (TCFD) and the US Securities and Exchange Commission (SEC), have called for mandatory climate risk disclosures reporting from companies.
Watch Dr Oliver Wing discuss this research in an interview with Sky NewsFathom’s research finds that existing data significantly underestimates exposure to flood risk
Collaborative work with the EPA suggests a threefold increase in total exposure to a 100 year flood.
In this research, Fathom found that there are 13 million Americans currently living within FEMA’s flood zones and therefore identified as at high risk of a 1-in-100 year flood (light blue).
In comparison, academic analysis on Fathom’s US flood hazard data finds that the actual figure is closer to 41 million Americans (light + dark blue).
Read more on Fathom’s research in the U.S.
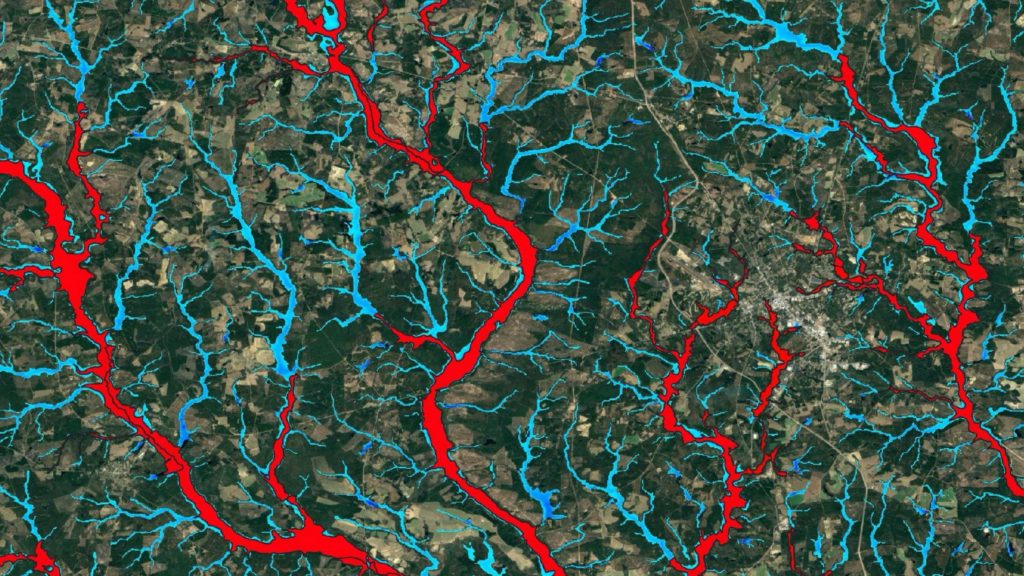
Predicting flood risk outside FEMA flood zones
FEMA’s model only covers major rivers and other high-risk zones that are relatively easy to predict. Many impacted areas are outside these FEMA-predicted flood zones. Research examining historical claims in Greater Houston found that 47% of flood claims made to FEMA were outside of FEMA flood zones (Highfield, 2012).
Similar research from Bradt, Kousky and Wing (2021) found that voluntary purchases of flood insurance in the US disproportionately take place in areas highlighted as high risk in Fathom’s US flood model. This indicates that Fathom’s flood hazard data accurately identifies flood areas missed by FEMA.
How can Fathom help?
Efficiency
Where data is incomplete or out of date, building models from scratch is expensive and slow. Fathom offers flood risk data for the whole planet at up to 30 meter resolution and at a fraction of the cost and time, accelerating projects.
Validation
With so much data to choose from it can be difficult to determine its reliability and validity. All of Fathom’s data and methods come from decades of peer-reviewed research, available for free online.
Consistency
Fathom provides flood maps at a global and continental scale. This gives users consistent global and in-country coverage, making all assets equal.
Future risk
Demand for robust development of assets, resilient to climate change, is growing. Fathom will be releasing future climate scenarios flood for its US and Global models later this year.
Case study: The Texas Water Development Board
How Fathom data was used to deliver the first flood planning programme for Texas.
In 2019, the Texas Legislature tasked the Texas Water Development Board (TWDB) with delivering the first-ever state-wide flood planning programme for the State of Texas.
In order to meet their objective, the TWDB gathered together all available flood-related data in a Flood Planning Data Hub. However, there was a gap in the publicly available data as approximately 63 counties did not have any existing flood maps.
The Texas Water Development Board incorporated Fathom’s data into the floodplain quilt layer to fill in the gaps where regional flood data was outdated or unavailable.
Read the case study