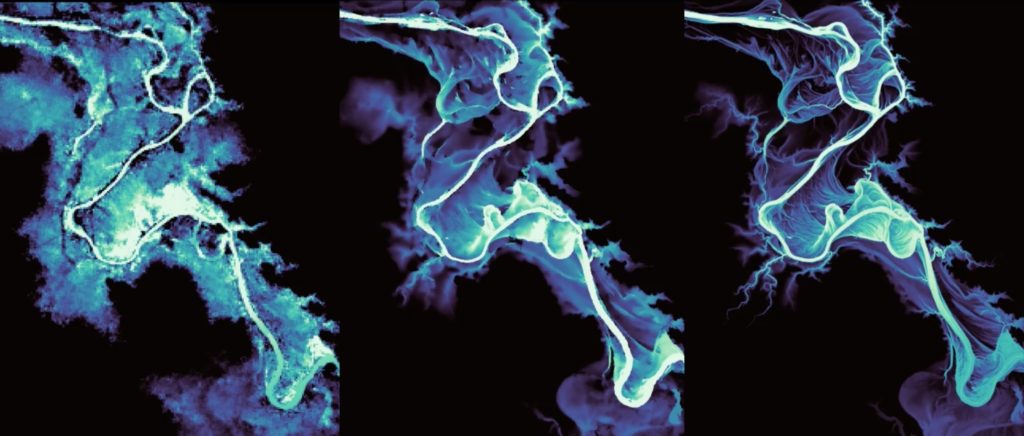
The above animation shows a hydrodynamic simulation of a flood in Queensland, Australia, over three different terrain datasets.
Simulated on the left is MERIT DEM, the best available global terrain dataset circa 2019. Developed by Prof. Yamazaki at the University of Tokyo, the data offers a globally consistent terrain model at ~90 meter resolution. This data underpins Fathom-Global 2.0.
The middle shows the simulation run over FABDEM, a new global terrain dataset released last month and the first global digital elevation model (DEM) with forests and buildings removed at ~30-meter resolution. Fathom has produced this data alongside the University of Bristol, where Dr Laurence Hawker worked as the lead researcher.
Laser Altimeter data (LiDAR), simulated on the right, is only available in a small number of territories and can be regarded as a benchmark ‘truth’.
What does this comparison tell us?
What is clear from this animation is the rapid progress we’re making in our ability to build global flood hazard models. Terrain data is the most critical element of any flood model: we need to know where water flows to simulate flood hazard correctly.
In the first version of Fathom-Global, released in 2015, we were reliant on a custom processed terrain data set derived from data collected by NASA’s space shuttle (Sampson et al., 2015). The data represented the best available at global scales, but contained numerous systematic errors that hindered the accuracy of subsequent models.
Fathom-Global 2.0 launched in 2020 with significant improvements. This included new hydrography data, giving the model a better representation of river channels, both in terms of where they are and how they convey water. A new DEM also provided an improved picture of the Earth’s surface.
Global 3.0, launching later this year, underpinned by FABDEM represents another step-change in our ability to simulate flood hazard anywhere in the world. The animation illustrates that we are getting close to the skill of local scale models.

Merit DEM vs FABDEM
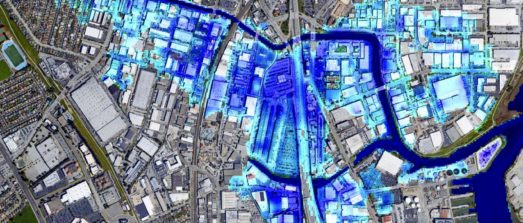
The below visual highlights the differences between MERIT DEM and FABDEM.
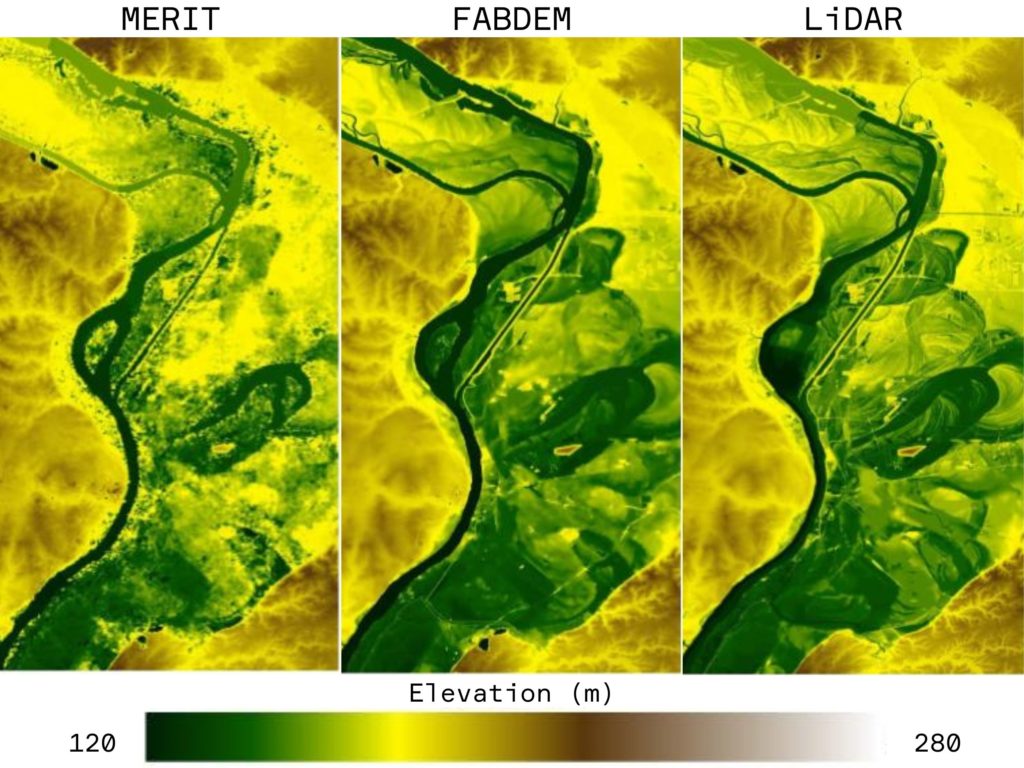
This graphic is a terrain map of St Louis, America. MERIT DEM seemingly contains much more noise compared to FABDEM and LiDAR. This noise is primarily due to trees and buildings but also a consequence of less precise instrumentation. FABDEM is visualised in the middle. Users can see that the features and contours shown in FABDEM are more realistic than those in MERIT. This is promising and demonstrates just how much improvement has been made in our ability to represent the earth’s surface.
A 30 m global map of elevation with forests and buildings removed
This work signifies one of the biggest step-changes in global flood modelling capabilities since the advent of the field.
Using FABDEM to model flood
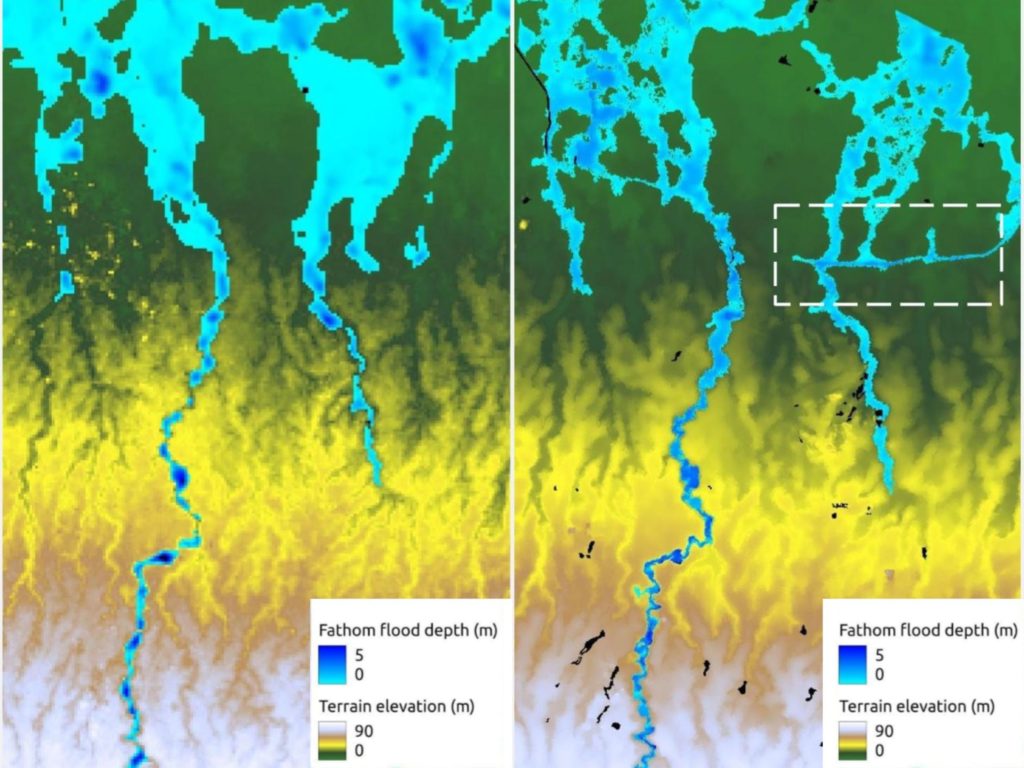
This comparison is a flood simulation of Jakarta. The capital of Indonesia is one of the largest cities in the world and suffers from frequent flooding due to a low-lying topography, land subsidence and monsoon rainfall.
Jakarta is one of the most difficult cities in the world to model, principally owing to its very flat and highly urbanised terrain. This has historically resulted in global terrain data containing large errors. Moreover, Jakarta city itself contains many small river pathways that drain from higher elevations to the south (see figure). These small river pathways do not produce very well defined floodplains and are therefore difficult to identify in global, radar based terrain data.
As illustrated in the picture, FABDEM appears to represent small flow pathways in the city with more fidelity. Interconnected floodplains, with less discontinuities than are present in the MERIT simulations are more plausible representations of flood hazard.
The circled section on the FABDEM example represents a small-scale flow pathway that has been built to direct water around the city and prevent flooding in the centre of the city. This is not visible in the MERIT DEM example and demonstrates the significant improvements that have been made in representing small flow pathways.
Global 3.0 is coming. Register your interest.
By registering your interest you will receive exclusive content, previews of data and be the first to access the model when it has launched.