
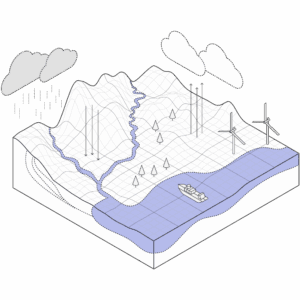
The interaction of water with the natural and built environment is highly complex and, as a result, flood model data comes in many degrees of precision. Digging deeper helps you make the right decision first time.
Flood risk is increasing globally. In the US, Fathom estimates it will almost double by 2050. This is down to population growth, urbanization and climate change – and all three drivers compounding each other.
At the same time, policy is shifting, regulations are tightening and traditional data providers are undergoing major change. More than ever, engineering and public-body risk professionals are demanding high-resolution, climate-aware data, and they are turning to private providers to supplement what’s publicly available.
Whether you are using public data, private data or a blend of both, and whether you’re working on design or resilience planning, you need to be sure that the tools you’re using offer precision and transparency.
We know that no flood map or model is 100% accurate and uncertainty is an inherent feature in all of them. There is a phrase often used by flood scientists: all models are wrong, some models are useful.
So how do you know if the product you’re considering is useful? We would encourage you to ‘look under the bonnet’ and explore the data sources, methodologies and underlying assumptions that underpin any flood map, model or dataset. Here are 10 key questions to ask:
10 questions to ask your flood data provider
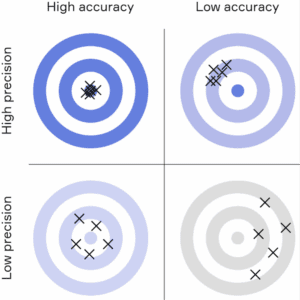

Flood models are often judged by their resolution. However, while it is true that higher resolution models are more detailed and precise, they are not necessarily more accurate. In fact, they can be misleading because they could give the impression that the underlying data are more certain than they really are.
A model is only as good as its worst component, and there is a limit to how much resolution alone can improve the model. Street-revolving elevation data will not produce accurate results if you have no information on local drainage systems, for example. Fathom’s research has also shown that vertical accuracy, parameters and boundary conditions are far more influential on model outputs than resolution.
The question to ask is not “how high is the resolution?” but rather, “is the resolution commensurate with the accuracy of other flood model components?
Learn more about Fathom’s research into the effect of grid scale on model accuracy. Read the insight, Does Element Size Really Matter?
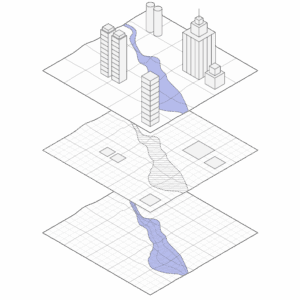
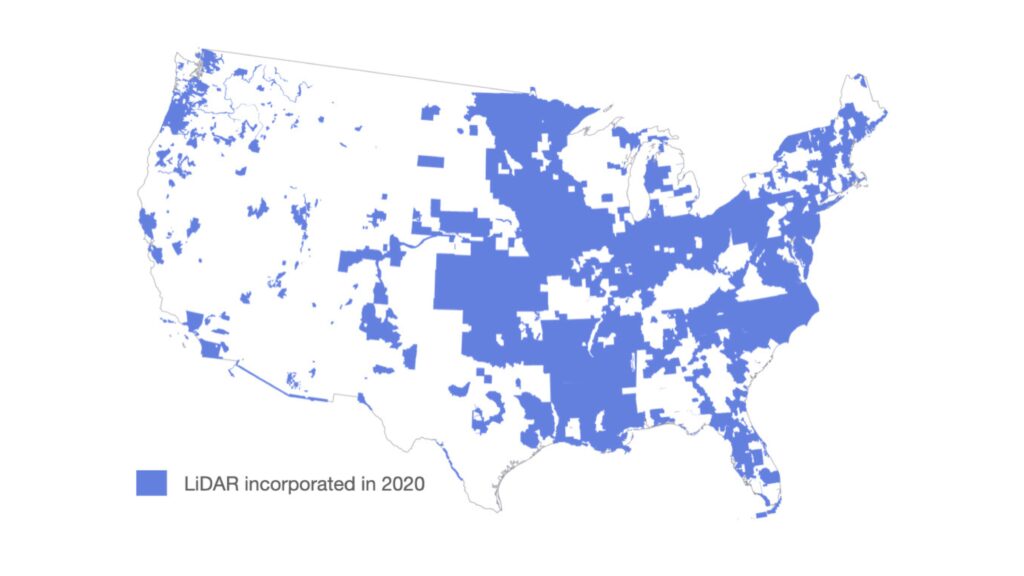
Terrain data is a critical component of flood models but the level of coverage and quality fluctuates between the terrain datasets that are currently available.
The gold standard for flood data is LiDAR (Light Detection and Ranging). LiDAR coverage has improved dramatically in the past few years – the illustration above shows how much US coverage increased between 2020 and 2023.
This means that a flood map of just three years old might not incorporate LiDAR data and could be missing out on crucial terrain information. The quality of terrain data has a big influence on the usefulness of flood models, so it’s important to know what source your provider has used.

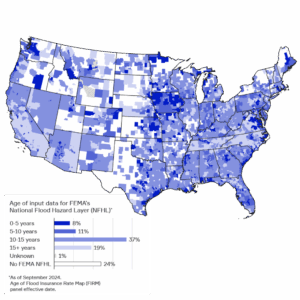
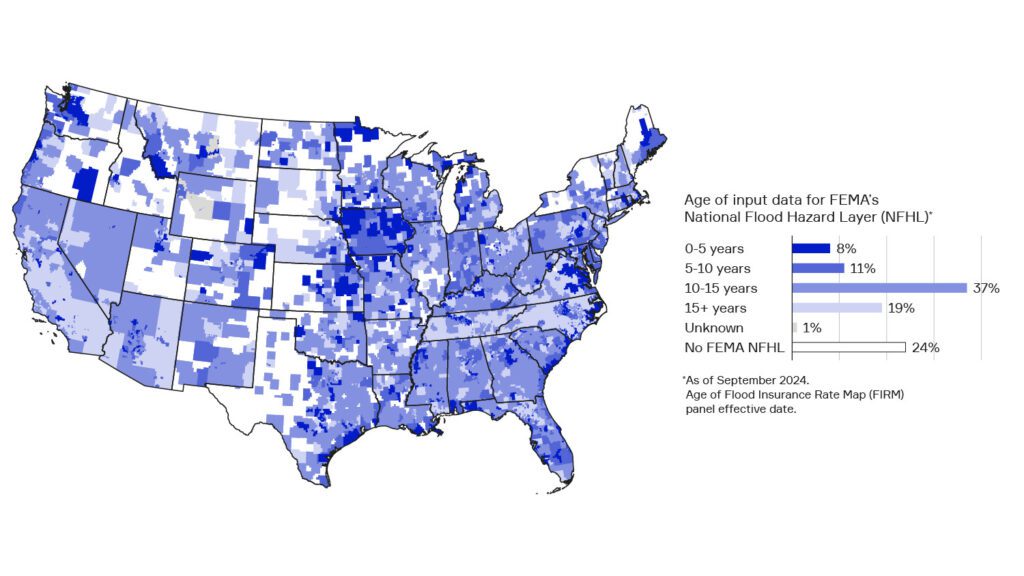
Government-produced flood maps in the US vary significantly in both coverage and age. FEMA’s national flood hazard-layer maps are a patchwork of individual, reach-scale maps that currently only cover about 60% of the continental US. And only 19% of the country is covered by maps less than 10 years old.
This means that maps of your area of interest, whether it’s a single site, a county or a state, could either be out of date or missing a flood hazard layer altogether. It’s crucial to use the most up-to-date flood data to reflect current and future flood risks, particularly now that new and more exacting standards require you to consider extreme events.
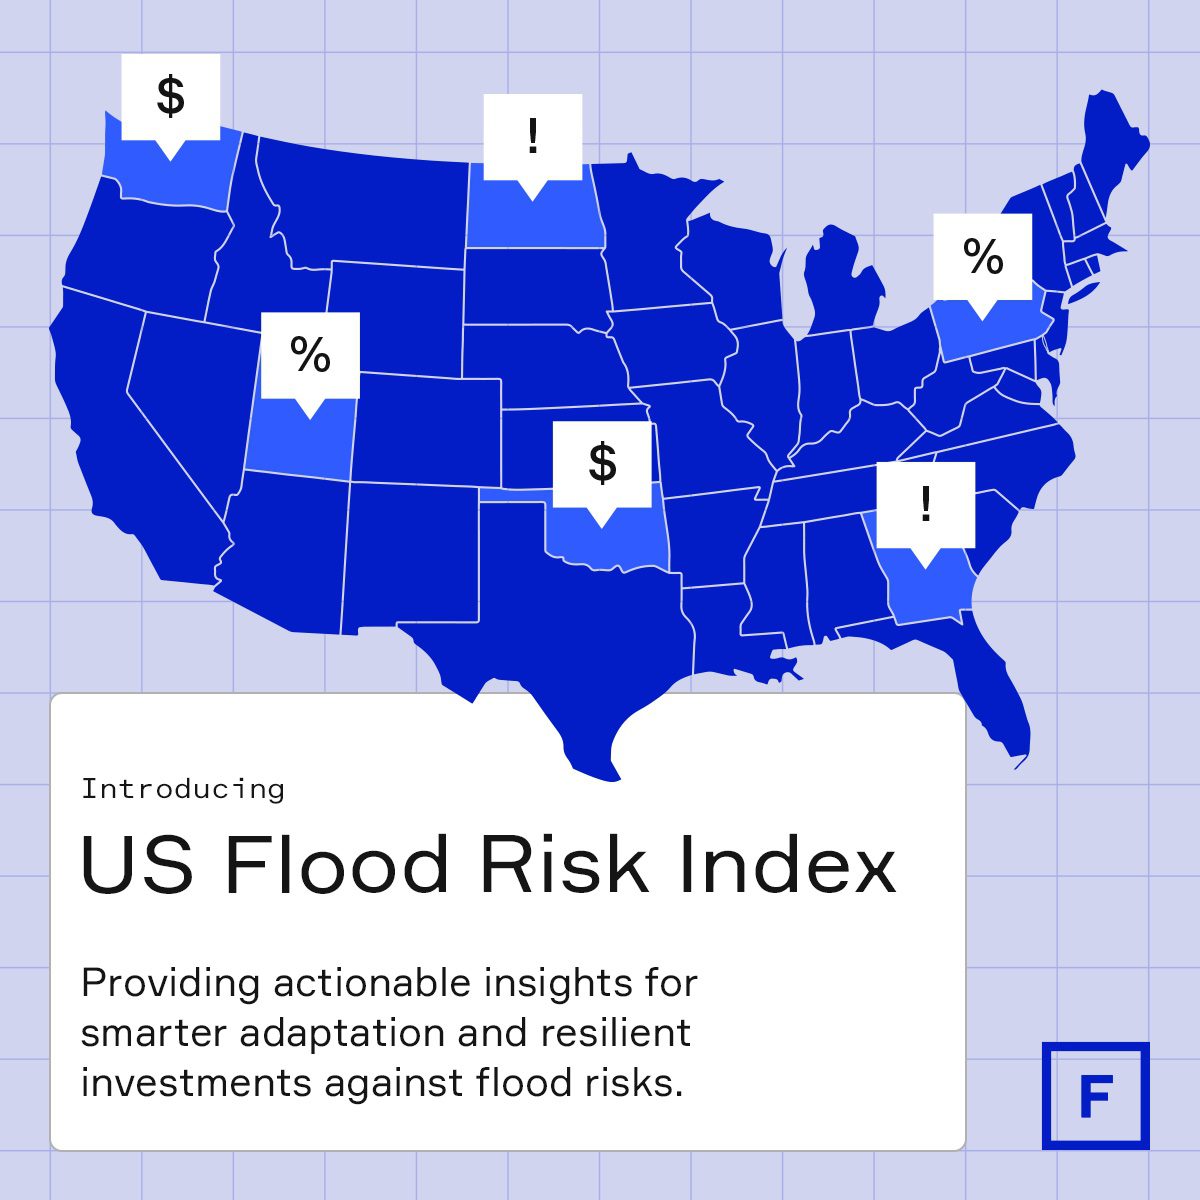
Fathom’s Flood Risk Index, which offers a snapshot of flood risk in every US state, shows that:
States with the lowest FEMA map coverage include: Idaho (33.1%), Utah (50%), Maine (50%), New York (51.9%), Kansas (52.6%) and Texas (53.7%).
States with the highest % of FEMA maps that are more than 10 years old include:
Nevada (99.5%), New Hampshire (97.2%), Arizona (94.3%), South Dakota (93.9% and Utah (93.6%).
For more facts and figures on flood risk in your state, visit our US Flood Risk Index.
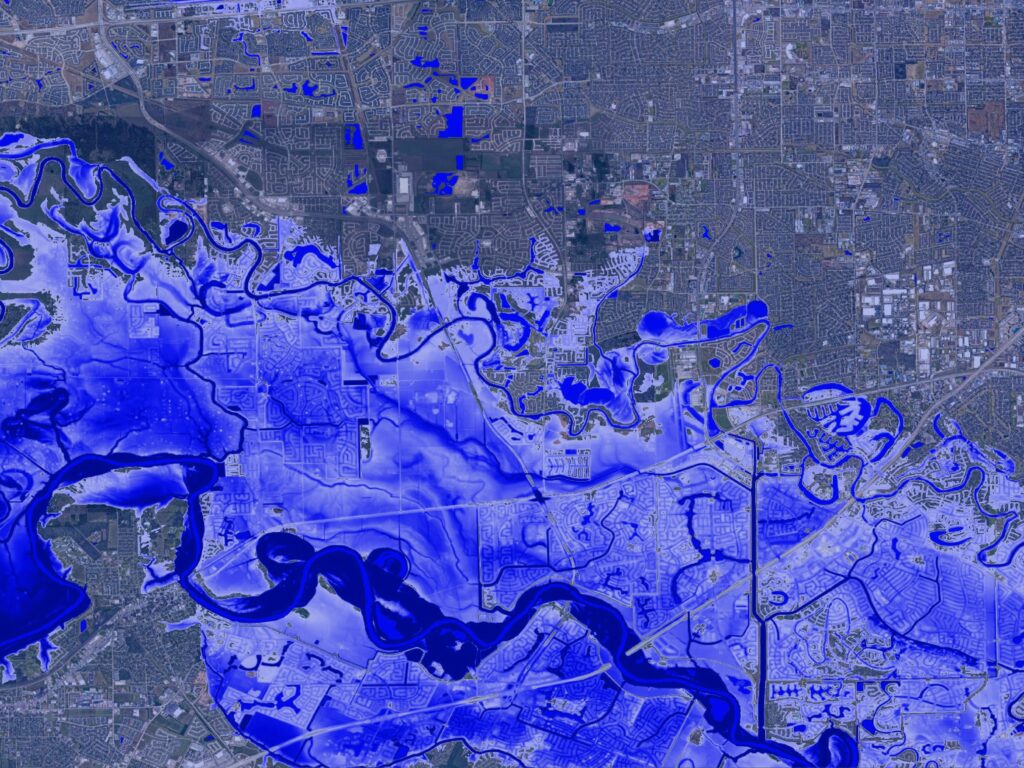
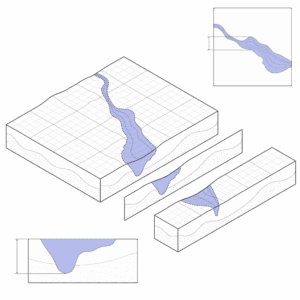
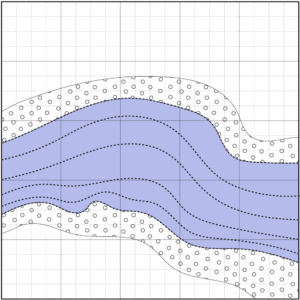
To simulate flood accurately, a model needs to know the bathymetry (i.e. the depth) of river channels. Many models use “bathtub”, “HAND” or 1D modeling, which oversimplifies flood behavior by assuming water spreads uniformly, ignoring flow dynamics and terrain. This can lead to underestimation of complex flood risks, so it’s crucial that river channels are explicitly represented in the map/model generation process.
It’s also important to ask whether it represents smaller streams and rivers as well as the large ones, and whether it considers both pluvial (flash) and fluvial flooding. Models that exclude smaller channels or pluvial flooding could be missing significant flood hazards.
Understand the limitation of bathtub modeling by reading the summary of our research paper: ‘Flooding is not like filling a bath’.
66% of the 3.5 million stream miles in the US are yet to be mapped by FEMA, according to a 2021 report from ASFPM.
Flood defenses are a major blind spot in flood data. There are no comprehensive records of them at the global scale, and databases in the US are only around a third complete.
The US Army Corps of Engineers’ National Levee Database (NLD) contains records for about 7,000 levee systems, totaling ~25,000 miles of infrastructure. However, the NLD covers only a fraction of total US levees (around 40–50% by estimated system count or miles).
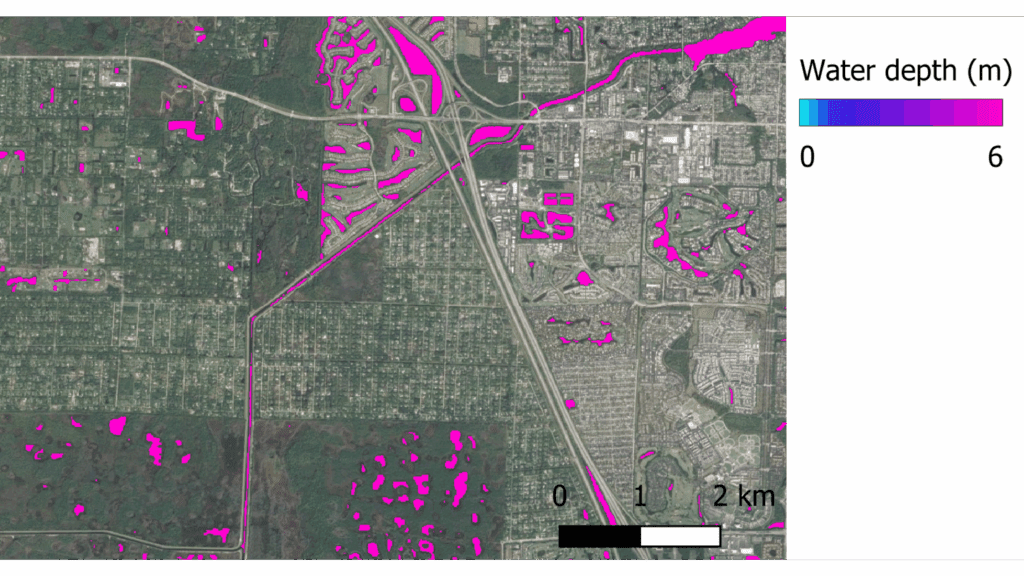
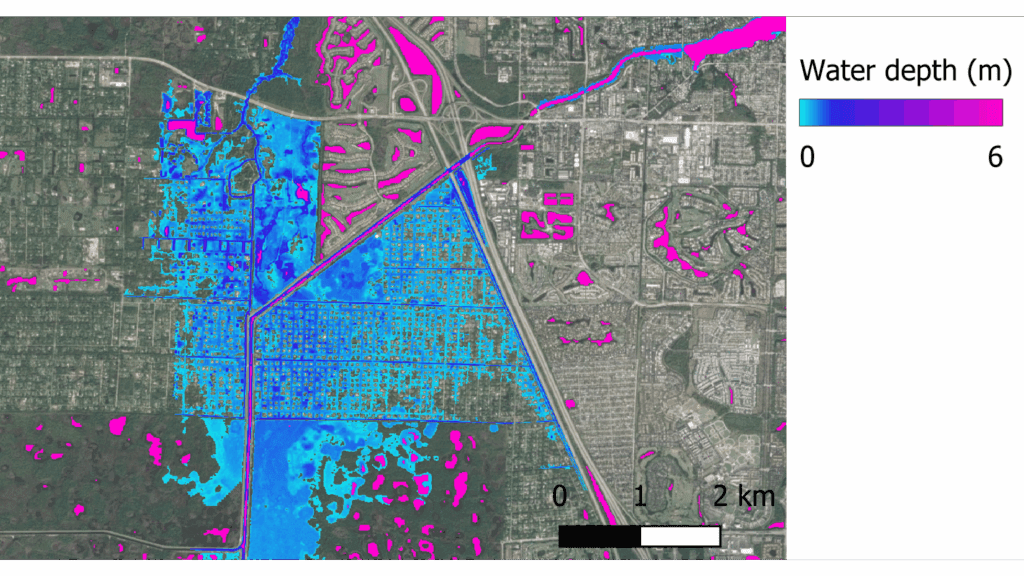
Nonetheless, representing flood defenses is crucial to obtaining an accurate view of risk. Below are two Fathom flood maps of Palm Beach County, Florida, showing the dramatic difference between undefended and defended views.
The flood defenses themselves, both where they are and the protection they provide, should be modeled and the relevant assumptions clearly defined.
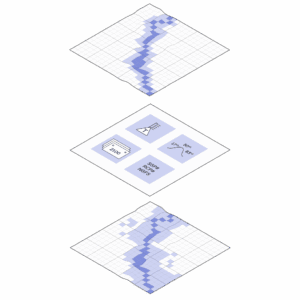
Uncertainty in modeled views can vary depending on factors such as which input data, methodologies and climate scenarios you choose. Model vendors should show you where the uncertainty lies by providing a view of the underlying data and sampling of the uncertainty range.
Fathom’s Metadata, for example (see below), includes information on native resolution, date of capture, source data type and certainty rank. This helps you to better understand how influencing factors such as terrain, climate or defenses may impact the certainty of flood risk.
Ask your provider how their product allows you to understand what is driving the uncertainty behind it.
Learn more about Metadata — Fathom’s first-of-its-kind assessment of flood risk data certainty.
How do you prevent climate model errors from affecting the flood model, and what range of scenarios can be modeled?
As extreme flood events become more common, regulations and standards become more exacting. ASCE’s new 24-24 standard advises:
- Expanding the flood hazard area to include the 500-year floodplain
- Considering elevation requirements for some structures up to the 1,000-year flood
- Coastal floodplain calculations must now account for projected sea level rise
However, requirements differ across organizations and regulators, so flexibility in climate frameworks is key. Ask your provider which combinations of future year and climate scenarios their flood hazard data allows.
Also, using global or regional climate data for local-scale flood models is difficult and replete with contested choices around which model to use and how to apply it. A clear explanation is crucial.
Flooding can result from pluvial (rain-induced), fluvial (river) and coastal surge. Pluvial flooding is overlooked by FEMA maps, despite being a major component of risk, especially in small headwater catchments and urban areas where assets are more condensed.
For a truly comprehensive view of flood risk, maps and models should include all three sub-perils. If yours does include all perils, ask if and how these drivers interact within it, and make sure they are represented across all regions of the model domain.
When assessing and quantifying flood risk, understanding extent and depth is only one piece of the puzzle. Urbanization is one of the main drivers of future flood risk, for example, so you need to be able to overlay flood hazard information with other datasets such as exposure, environment and population.
Easy integration into the platforms you’re using is essential, as is flexible accessibility. Ask if the data you’re considering is available in all these ways: API, portal, direct and through partners.
Thorough validation of flood data is a crucial step in any risk assessment exercise. The methodologies underpinning the data should be scientifically validated, peer-reviewed and the results published in established research journals.
Also, ask if the methodologies are fully available for you to conduct your own evaluation. Any flood data validation effort should use as much benchmarking data as possible to avoid selection bias: there are numerous datasets in the US that are a good starting point.
“Always ask about the methods used by any model provider. Don’t accept brush-offs like ‘it’s AI and very complex’ or ‘it’s commercially sensitive, so we can’t tell you’. Both are completely inadequate answers.” Prof. Paul Bate OBE FRS
Read more about how Fathom’s data has been extensively validated in the US below.
We hope these questions are helpful when evaluating the many flood risk data, tools and providers that are available. Vendors should be able to answer all of these questions, willingly, fully and openly.
It’s important to note there is no one-stop shop – multiple datasets from multiple providers, both private and public, are necessary to obtain a holistic, comprehensive view of risk. The common trait to look for in each of them is full transparency.