

Fathom’s Dr Oliver Wing and Dr James Savage on why a finer resolution model is not always the best one.
It seems intuitive that a fine resolution flood map is better than a coarse resolution one. After all, the finer the spatial resolution, the more detailed and precise the estimates of locations that are likely to be flooded.
But the truth is that while finer resolution models are more detailed and precise, they are not necessarily more skilful at determining areas at risk of flooding. In fact, they can be misleading to end users because they might not reflect the accuracy or uncertainty in the data underpinning them.
Precision vs accuracy in flood modeling
Precision does not equal accuracy
At the time of writing, the most accurate global dataset is the Copernicus DEM (COP-DEM), produced at 30 m resolution and derived from the TanDEM-X mission data collected between 2011 and 2015. There are more accurate terrain datasets available, such as those derived from LiDAR, but LiDAR data cover less than 10% of the Earth’s surface.
However, the benefit of using such accurate datasets is often due to their higher vertical accuracy, not their spatial resolution. There is often little benefit to running flood models at native LiDAR resolution (1–5 m grid spacing) compared with, say, 30 m, because there is a limit to how much resolution can improve the model in isolation.
We have evidenced this in peer-reviewed scientific literature, showing that finer resolution flood models do not always lead to more accurate results. We’ve also found that spatial resolution is far less influential on model output than parameters and boundary conditions.
Fathom’s Global Terrain Data – FABDEM+, based off of COP-DEM with ML techniques and high-quality LiDAR, provides the new standard for a globally consistent and accurate digital elevation model.
A model is as good as its worst part
The consequence of this is that a flood model is only as good as its weakest component. If your input river flows have ±40% error, what is the value of a metric-scale terrain grid? If you have no information on local drainage systems, does it matter that your elevation data is street-resolving?
The components of a modeling framework need to be commensurate with one another.
Modelers should focus on improving the framework as a whole so that it is as close a representation of physical reality as possible, rather than on producing (overly) precise models at ever finer resolutions.
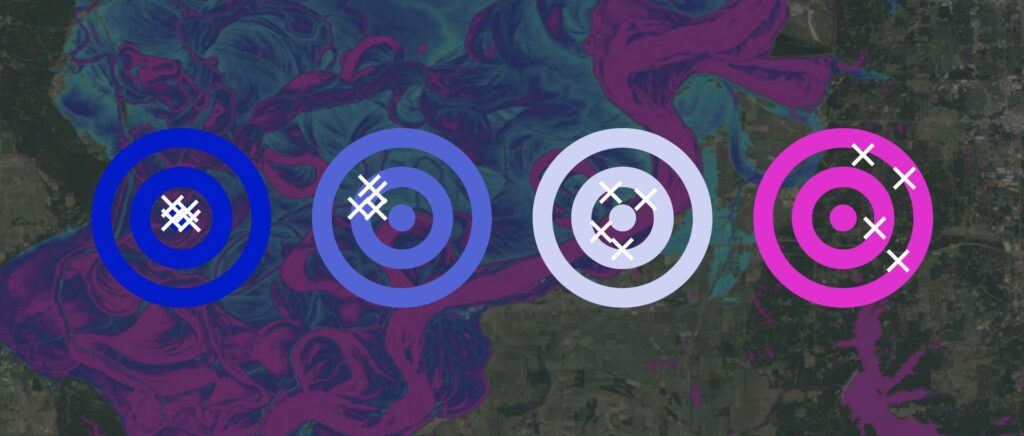
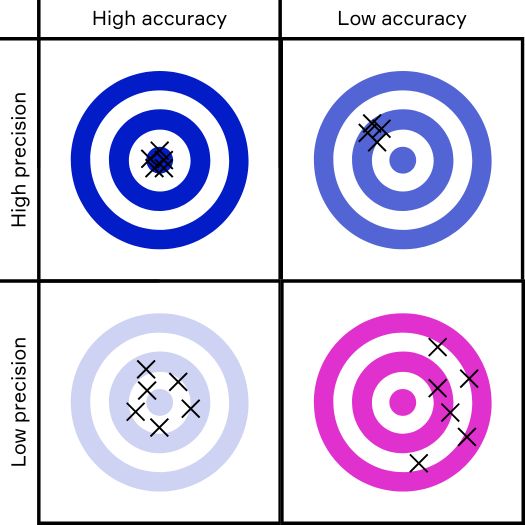
A neat way to illustrate this is with the dartboard images on the right. Here, “accuracy” is the skill of a flood model and “precision” is the spatial resolution.
The bright blue dartboard (top-left) represents the best case – a highly accurate model that is also very precise.
The pale dartboard (bottom-left) represents a model that is good, but at a coarse resolution.
The mid blue dartboard (top-right) is arguably the worst case. The end user is likely to be unaware of its low accuracy, but the high precision could give a false perception of the intrinsic skill of the model.
The pink dartboard (bottom-right) is clearly undesirable, but at least the end user would be wary of its robustness, given the commensurately low-precision.
While the bright blue dartboard remains elusive at the global scale, we favor the pale blue dartboard over any of the others.
Occam’s Razor: Keep it simple
14th-century philosopher William of Occam said that the more assumptions you add to a theory, the more possibilities for error. In other words, if there’s a simple way (i.e. a coarser model) and a hard way (a fine model) and both give equally accurate results, go for the simple way. So if maps with finer resolution have the same intrinsic skill as the coarser resolution maps, then the coarser model is the better one.
Accuracy and precision in real-world modeling
You can see the accuracy–precision relationship of a real-world modeling example in the images below.
We modeled inundation on a tiny section (1.3 x 0.6 km) of floodplain. Although the 3 m resolution flood maps are kinder on the eye, that is all they are. They are no more skilful in the identification of flooded areas than the coarser 30 m maps.
However, if we vary the flow inputs within their likely error margin, this has a much more drastic impact on the extent and depth of inundation.
The spatial resolution has little effect on your view of risk, yet may have misled you into thinking its precision means it is accurate. Meanwhile, the true accuracy of the flood model is illustrated by the impact of flow estimation uncertainty.
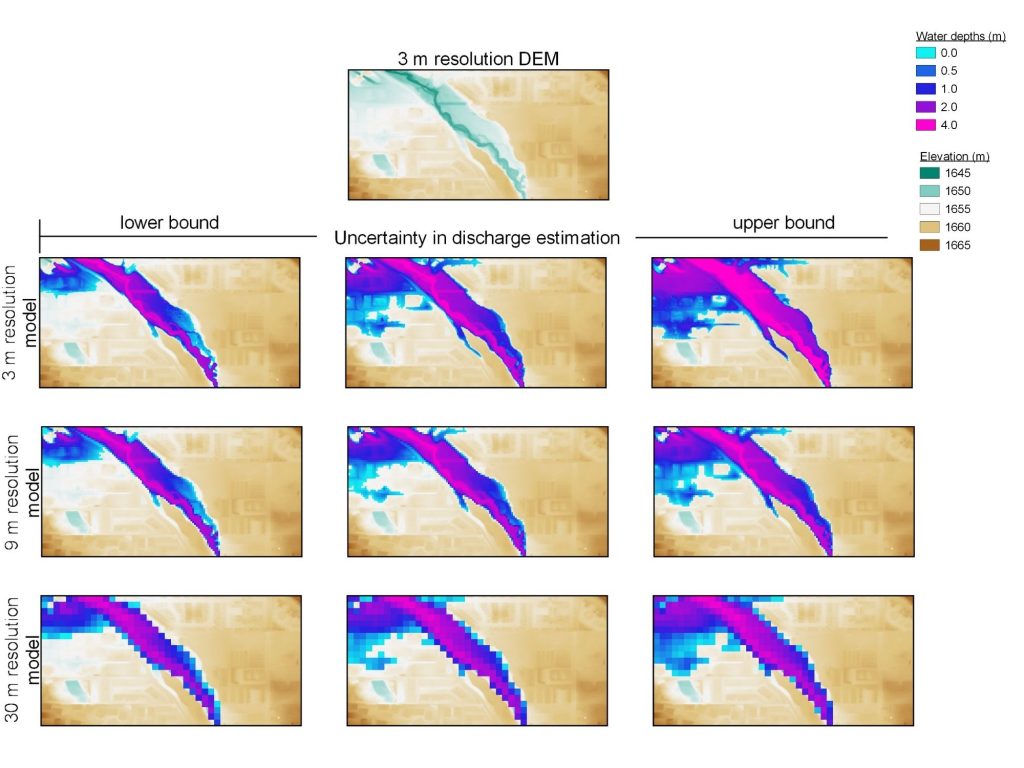
It is worth noting that the 10 m and 3 m resolution simulations took 13x and 412x longer respectively to run than the 30 m data — for little conceivable benefit. This enormous extra (and largely wasted) compute load often leads modelers to find other ways to speed things up – by simplifying the hydraulics, for example. This can have a very real impact on the accuracy of the simulation.
The role of uncertainty and transparency
Despite the advances in terrain mapping in the past 20 years, there are still fundamental limitations to flood modeling over large areas. As Prof Paul Bates, Fathom’s chairman, notes in this Nature article, “Boundary condition and flood defense errors mean that flood maps are uncertain, but this is often ignored in the rush to present ‘precise’ predictions to end users.”
How do flood modelers work within these limitations and this uncertainty, without overpromising to clients or losing their confidence? The key is openness and transparency.
This need for transparency is the reason that Fathom launched Metadata, an extension to our US and Global Flood Maps, which ranks from 1-10 how certain we think each model component is – and therefore how much confidence we have in the maps in different places. These certainty ranks help users to not only understand how risky a location is, but also how certain we are about that level of risk.
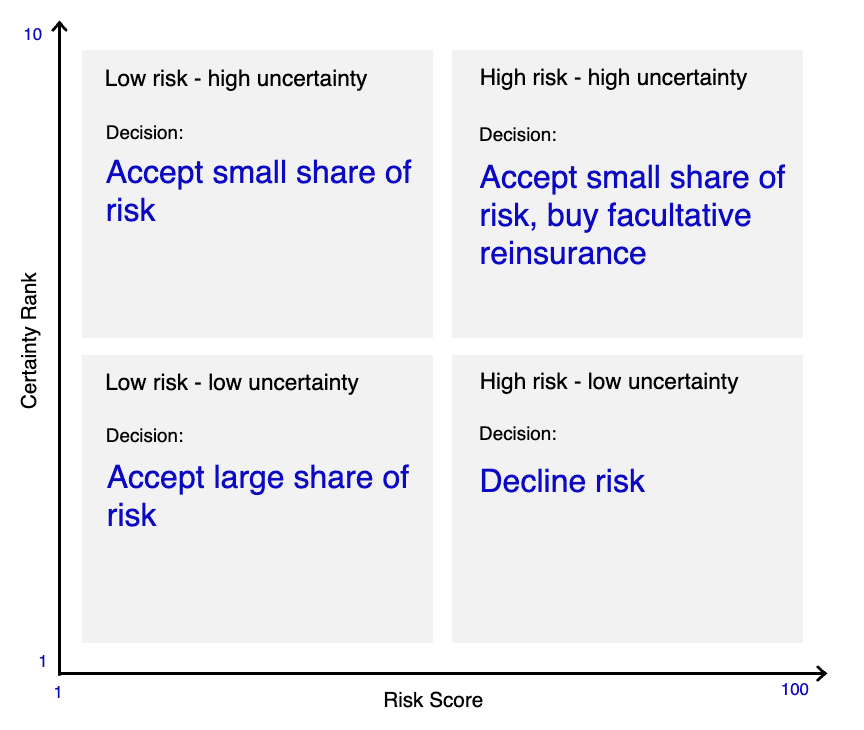
Taking insurance underwriters as a use case, the graph above shows how certainty ranks might be helpful in making decisions around risk.
In conclusion, finer resolution, more precise, flood maps can be no more accurate than coarser ones if other model components are not of commensurate fidelity. While the fundamental limitations of flood modeling still exist, being aware of them and knowing exactly where the uncertainty lies is the best strategy when it comes to making better, more informed decisions.
Find out how Metadata can help you understand uncertainty and make more informed decisions

Get in touch to find out more about our products and modeling capabilities.