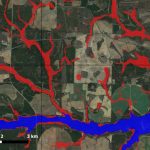
US Flood Risk Index
Fathom’s US Flood Risk Index is intended to help flood risk professionals and asset stakeholders to understand the risk in their state.
The index combines publicly available US flood risk data with Fathom’s peer-reviewed research and flood-mapping expertise. It provides actionable insights that drive adaptation strategies and inform investment decisions aimed at reducing flood risks.
We reveal where flood risk is expected to rise the fastest, both in terms of financial loss (AAL: average annual loss) and population exposure. We explore how well-prepared states are to address flood risk by analyzing the coverage and age of FEMA’s Flood Insurance Rate Maps (FIRMs).
We uncover which proportion of the expected financial losses are outside FEMA’s officially designated Special Flood Hazard Areas (SFHA) – a statistic that indicates whether flood exposure could be under-mapped and under-estimated. And we show the vulnerability of road and rail infrastructure, both now and in the future.
Alabama
Arizona
Arkansas
California
Colorado
Connecticut
Delaware
District of Columbia
Florida
Georgia
Idaho
Illinois
Indiana
Iowa
Kansas
Kentucky
Louisiana
Maine
Maryland
Massachusetts
Michigan
Minnesota
Mississippi
Missouri
Montana
Nebraska
Nevada
New Hampshire
New Jersey
New Mexico
New York
North Carolina
North Dakota
Ohio
Oklahoma
Oregon
Pennsylvania
Rhode Island
South Carolina
South Dakota
Tennessee
Texas
Utah
Vermont
Virginia
Washington
West Virginia
Wisconsin
Wyoming
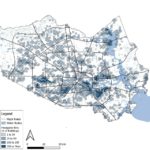
Alabama

A southeastern US state with a diverse topography, ranging from mountains in the north to coastal plains in the south.
- Total Area: 52,420mi²
- Population: 5.2m
- Capital: Montgomery
Alabama has a varied geography, with an elevation ranging from sea level to more than 2,413 ft and a warm, humid climate with high levels of precipitation. The state is susceptible to severe weather, including tropical cyclones and hurricanes, and it experiences coastal storm surges from the Gulf of Mexico, heavy rainfall and flooding from the Tennessee and Black Warrior Rivers.
While FEMA map coverage is very good (100%), 74.3% of those maps are more than 10 years old. Meanwhile, the average annual population exposure to flood risk is expected to increase by 172% between 2020 to 2050.
Currently, only 48% of Alabama’s average annual financial losses sits within the FEMA SFHA, rising to 49% in 2050. This means more than half of its financial risk comes from areas where flood insurance is not mandatory and the exposure could be underestimated.
Financial
Coverage
Exposure
Infrastructure
Arizona

The 6th-largest US state by area, known for its deserts, canyons and hot climate. Flash flooding is a common problem.
- Total Area: 113,990mi²
- Population: 7.6m
- Capital: Phoenix
Arizona’s diverse population and economy has grown dramatically since the 1950s, largely thanks to inward migration. The state has extremely hot summers and mild winters and flash flooding from monsoon rains is common, especially in arid desert regions and urbanized areas.
Despite 100% of the state being mapped by FEMA, 94.3% are more than 10 years old. LiDAR coverage is also low, at only 42.6%.
Currently, only 81% of the average annual losses occur within the FEMA Special Flood Hazard Area – the third highest percentage in the US Flood Risk Index. That means $253.5m of financial losses occur in places where flood insurance is not mandatory and floodplain management regulations are not enforced.
Financial
Coverage
Exposure
Infrastructure
Arkansas

Landlocked southern state at the confluence of major rivers including the Mississippi, the White River and Arkansas.
- Total Area: 53,179mi²
- Population: 3.1m
- Capital: Little Rock
Arkansas, known for its large wilderness areas, has hot, humid summers and mild winters. The state is prone to flooding from the Arkansas and the Mississippi, as well as flash flooding driven by heavy rainfall in mountainous areas.
Growth in population and shifting weather patterns will see the average annual population exposure rise by 192% by 2050.
Identifying which areas are at high risk of flooding is crucial. Currently, 52.9% of projected average annual financial losses, amounting to an estimated $109.5m, occur outside the designated FEMA SFHA zones. While there is good FEMA map coverage at 82%, 91.9% of those maps are more than 10 years old.
Financial
Coverage
Exposure
Infrastructure
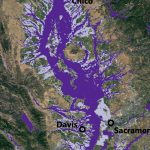
California

The most populous state in the US. Flooding, exacerbated by wildfires, is a widespread natural hazard.
- Total Area: 163,695mi²
- Population: 39.4m
- Capital: Sacramento
California’s diverse landscape includes mountains, deserts and forests, as well as 840 miles of coastline – the third-longest in the US. Its equally diverse climate ranges from Mediterranean-like coastal towns to cold mountain regions and arid heat in the Mojave desert.
Most of its 58 counties have a history of severe damage from flooding, whether driven by intense winter storms, snowmelt or flash flooding exacerbated by wildfires. Its coastal roads are also at risk of flooding from storm surges, high tides and other rises in sea level – the state is no. 2 in the index for the longest length of road at risk of flooding (1,020 miles).
However, 79.9% of California’s average annual losses currently occur outside FEMA’s SFHA – one of the five highest in the index – which indicates a significant potential gap in mapping and insurance coverage. FEMA map coverage is nearly 100% but 92% of those are more than 10 years old, and LiDAR coverage is only 52.3%.
Financial
Coverage
Exposure
Infrastructure
Colorado

The western state of Colorado has the highest average elevation in the US, with snow-covered mountains giving way to rolling plains.
- Total Area: 104,094mi²
- Population: 6m
- Capital: Denver
Colorado features diverse geography, including the Rocky Mountains, high plains and arid plateaus. While the state is a long distance from any large bodies of water, many of its residents live in flood-prone areas, especially along the Front Range urban corridor.
Seasonal snowmelt, intense thunderstorms and rapid rainfall contribute to flash floods, particularly in mountain canyons and along rivers.
Currently, 6.7% of its road network is at risk of flooding, compared with the national average risk of 5.4%. Its rail network includes major routes through the Rocky Mountains and the Central Corridor, and 12.4% of it is at risk of flood (compared to 9.2% nationally).
FEMA map coverage is low at 68.1% and currently 75.3% of average annual losses are outside the FEMA SFHA.
Financial
Coverage
Exposure
Infrastructure
Connecticut

Connecticut is a mix of coastal cities and small rural towns and is bisected by the longest river in New England.
- Total Area: 5,543mi²
- Population: 3.7m
- Capital: Hartford
One of the five most densely populated states in the US, Connecticut is characterized by coastal plains and rolling hills, numerous rivers, including the 410-mile-long Connecticut River, and several major estuaries.
Connecticut faces significant risk of coastal flooding from hurricanes and nor’easters, storm surges and rising sea levels, as well as river flooding and intense rainfall. The economy includes industries such as finance, insurance and manufacturing.
Despite 88.1% FEMA map coverage, 78.9% of the maps are more than 10 years old. Currently, 64.6% of average annual losses, due to flooding, equating to an estimated $319.8m, sits outside the FEMA SFHA.
Financial
Coverage
Exposure
Infrastructure
Delaware

Mid-Atlantic state, the second smallest in the US by area. Delaware is low-lying and susceptible to coastal flooding.
- Total Area: 2,489mi²
- Population: 1.1m
- Capital: Dover
Characterized by flat coastal plains and low-lying topography, Delaware’s proximity to the Delaware River, Delaware Bay and the Atlantic Ocean make it vulnerable to coastal storm surges, tidal flooding and riverine flooding from heavy precipitation.
The second-smallest state in the US after Rhode Island, it is also the fifth-most densely populated.
Coastal resilience is a critical focus. The average annual financial losses are predicted to increase by 43.2% by 2050, well above the national average of 27.6%. Currently, 6.6% of the road network is at risk of flooding, increasing to 8.1% by 2050.
Financial
Coverage
Exposure
Infrastructure
District of Columbia

The low-lying District of Columbia is home to political and cultural institutions and several major bodies of water.
- Total Area: 68mi²
- Population: 702.3k
- Capital: Washington, D.C.
The District of Columbia, home to the US capital, has a low-lying and flat terrain and sits in a topographical bowl at the junction of the Potomac and Anacostia Rivers and the Washington Channel.
Flood risk comes from these rivers due to heavy rain and snowmelt in upper catchments, storm surges, and urban surface water floods.
The District of Columbia is in the top five for flood risk to road networks according to the index. Currently, almost 14% of the road network is at risk, rising to almost 15% by 2050. It also ranks no. 5 for the highest percentage of rail network at risk of flood.
Currently, 75.3% of the state’s average annual financial losses due to flooding sit outside the FEMA SFHA, and, despite 100% FEMA map coverage, 90.2% of the maps are more than 10 years old.
Financial
Coverage
Exposure
Infrastructure
Florida

Florida’s tropical and subtropical climate and low-lying, coastal location make it susceptible to extreme weather events.
- Total Area: 65,758mi²
- Population: 23.4m
- Capital: Tallahassee
Florida is a low-lying peninsula bordered by the Atlantic Ocean and the Gulf of Mexico, with a landscape that includes extensive wetlands, sandy beaches and the Everglades. The state has a humid subtropical to tropical climate, with hot, humid summers and mild winters.
Florida is vulnerable to extreme hurricane storm surges, tropical downpours and tidal flooding in low-lying areas and this flood risk is expected to increase significantly.
By 2050, the average annual losses (AAL) in Florida due to flooding will reach an estimated $7.4bn. That’s an increase of 73.6% since 2020, which is well above the national average of 27.6%, and the losses will account for 19% of national AAL.
The state is well covered by FEMA maps (99.9%) but most of those (60.3%) are more than 10 years old. Currently, 33.9% of average annual losses from floods sit outside the FEMA SFHA.
Financial
Coverage
Exposure
Infrastructure
Georgia

The southeastern state of Georgia is one of the US’s top states for increases in population exposure to flooding.
- Total Area: 59,425mi²
- Population: 11.2m
- Capital: Atlanta
Georgia, located in the southeastern US, has varied geography, including coastal plains, rolling hills and the Appalachian Mountains in the north. It has a humid subtropical climate with hot summers and mild winters and the state sees moderate to heavy precipitation.
The metropolitan area of Atlanta is a key economic hub and the sixth most populous in the US. Georgia faces coastal flooding and heavy rainfall from hurricanes and river flooding from major watersheds.
The average annual population exposure to flood is expected to increase by 236% between 2020 and 2050. This puts the state as second in the index for the biggest increases (the national average is 97.3%). Almost half (48.7%) of its average annual financial losses due to flooding currently occurs outside the FEMA SFHA.
The state is fully covered by FEMA (100%) but 80.1% of the maps are more than 10 years old.
Financial
Coverage
Exposure
Infrastructure
Idaho

A landlocked state in the Pacific Northwest known for its vast wilderness and mountainous landscapes.
- Total Area: 83,569mi²
- Population: 2m
- Capital: Boise
Idaho, in the northwestern US, is characterized by rugged mountains, forests and fertile plains. It has a varied climate, with cold, snowy winters in the mountains and dry, warm summers in lower elevations.
The state is home to the Idaho National Laboratory, the country’s largest Department of Energy facility and has an important agricultural sector that most notably supplies a third of the US’s potato yield.
Rapid snowmelt from mountain ranges and heavy spring rains can cause river flooding in the state, particularly along the Snake River and its tributaries. Flash floods exacerbated by wildfires are also a risk.
Idaho has low flood data coverage. Just 33.1% of the state is covered by FEMA maps – the lowest in our index – and 70.5% of those maps are more than 10 years old. LiDAR coverage is the third lowest at 29.1%.
Currently, 8% of Idaho’s road network is at risk of flooding, compared with the national average of 5.4%. An estimated 76.9% of average annual financial losses due to flood are outside FEMA’s designated SFHA, signalling a potential gap in mapping and insurance coverage.
Financial
Coverage
Exposure
Infrastructure
Illinois

Midwestern state with the sixth-largest population and the fifth-largest GDP in the US.
- Total Area: 57,914mi²
- Population: 12.7m
- Capital: Springfield
Illinois has a varied landscape of flat prairies and rolling hills as well as the shoreline of Lake Michigan. It experiences a humid continental climate with hot summers, cold winters and frequent storms. The state’s economic center is Chicago, a major financial and transportation hub, along with strong manufacturing and agriculture sectors.
Flooding is a significant concern – according to the Illinois department of natural resources it accounts for more than 90% of declared disasters in the state. The risk includes flooding of the Mississippi and Illinois Rivers, heavy rain and urban flash floods, and is exacerbated by complex drainage and water movement systems and risks of ice blocks.
Although there is reasonably high 86.3% FEMA map coverage, 88% of those maps are more than 10 years old. Currently, 76.8% of average annual loss (AAL) sits outside the FEMA SFHA, signalling a potential gap in mapping and insurance coverage.
Financial
Coverage
Exposure
Infrastructure
Indiana

A Midwest state with numerous rivers and 24% of its land area historically covered by wetlands.
- Total Area: 36,420mi²
- Population: 6.9m
- Capital: Indianapolis
Indiana, features rolling plains, forests and the Ohio River as its southern border. It has a humid continental climate, with hot summers and cold winters. The state’s economy is based on manufacturing, agriculture and logistics, with Indianapolis serving as a key economic center.
Increasing flood risks arise from heavy spring rainfall, snowmelt and swollen rivers, particularly near the Wabash. Urban and flash flooding driven by severe storms are also a concern.
The population exposure is expected to increase dramatically by 187% between 2020 and 2050 (the national average is 97.3%). Around 50% of average annual financial losses due to floods occur outside FEMA’s SFHA.
While FEMA map coverage is very good (97.6%), 53.4% of those maps are more than 10 years old.
Financial
Coverage
Exposure
Infrastructure
Iowa

A Midwest state bordered by two major rivers and with an increasingly urbanized population.
- Total Area: 56,273mi²
- Population: 3.2m
- Capital: Des Moines
Iowa, located in the Midwest, is characterized by rolling plains and fertile farmland, with the Mississippi and Missouri Rivers forming its eastern and western borders. It has a humid continental climate, with cold winters and hot, humid summers.
The state’s economy is heavily based on agriculture, particularly corn and soybeans, along with manufacturing and renewable energy. Flooding is a risk along major rivers including the Mississippi, Missouri, Des Moines and Cedar, driven by heavy rainfall and snowmelt.
Iowa is home to 940 small towns but the population is increasingly urbanized. The state is no. 1 in our index for the highest increases in population exposure to flood: between 2020 and 2050, the average annual exposure is expected to rise by 276% (the national average is 97.3%). Currently, 55.1% of current average annual losses occur outside the FEMA SFHA.
Financial
Coverage
Exposure
Infrastructure
Kansas

Central US state with an economy driven largely by agriculture. Severe storms and tornadoes are frequent.
- Total Area: 82,278mi²
- Population: 3m
- Capital: Topeka
Kansas, in the central US, is known for its vast prairies and flat terrain, with the Flint Hills providing some rolling landscapes. The state has a continental climate, with hot summers, cold winters and frequent severe storms and tornadoes.
While Kansas is less prone to coastal flooding, heavy rainstorms and overflowing rivers, such as the Kansas and Arkansas Rivers, can cause localized flooding, especially in low-lying areas.
The state ranks no. 5 in the index for highest increase in average annual population exposure – an estimated 204% rise by 2050. There is also low FEMA map coverage at 52.6%, with 52.2% of those maps more than 10 years old, and currently 61.9% of average annual losses due to flood occur outside the FEMA SFHA.
Financial
Coverage
Exposure
Infrastructure
Kentucky

Landlocked Kentucky, located in the Upland South, has a continuous border of rivers along three of its sides and a complex system of streams.
- Total Area: 40,408mi²
- Population: 4.6m
- Capital: Frankfort
Bounded by the Ohio River in the north and the Appalachian Mountains in the east, the Kentucky landscape is a mix of rolling hills, mountains and forests. It has the greatest length of navigable waterways and streams in the contiguous US, and the two largest artificial lakes east of the Mississippi River.
The state has a humid subtropical climate, with hot summers and mild winters. Flooding occurs along the Ohio and Kentucky Rivers, due to heavy rains and snowmelt. Flash floods in the Appalachian regions are also a risk.
The state has 100% FEMA map coverage but 74.3% of the maps are older than 10 years. Currently, 55.9% of average annual financial losses, amounting to $443.1m, sit outside the FEMA SFHA.
Financial
Coverage
Exposure
Infrastructure
Louisiana

Low-lying Louisiana is susceptible to hurricanes and severe flooding. It is the no.1 state for expected increases in average annual financial losses.
- Total Area: 52,378mi²
- Population: 4.6m
- Capital: Baton Rouge
Louisiana, located along the Gulf of Mexico, is dominated by low-lying wetlands, bayous and the Mississippi River Delta, making it one of the most flood-prone states in the US. It has a humid subtropical climate, with hot, humid summers and mild winters.
The state is highly vulnerable to coastal flooding from hurricanes and storm surges and river flooding from the Mississippi.
Its average annual financial losses due to flooding are expected to increase by 147% between 2020 and 2050, reaching almost $2.5bn. That’s the highest increase in our US Flood Risk Index, and well above the national average of 27.6%.
Currently, 38.8% of current average annual losses sit outside the FEMA SFHA, amounting to $449.3m. Despite 88.3% FEMA map coverage, 64.9% of those are more than 10 years old.
A significant increase in population exposure is expected, rising by 156% between 2020 and 2050. The proportion of road network at risk of flood is also high (11.2%) compared to the national average of (5.4%) – the third-highest in the index.
Financial
Coverage
Exposure
Infrastructure
Maine

The northeastern-most US state and New England’s largest. With over 80% of its total area forested or unclaimed, Maine is the most rural state in the US.
- Total Area: 35,380mi²
- Population: 1.4m
- Capital: Augusta
Maine is known for its rocky coastline, dense forests and the Appalachian Mountains. It has a humid continental climate, with cold, snowy winters and mild summers. With only approximately 39% of the state’s population living in urban areas, the state’s economy is reliant on fishing, tourism and forestry.
Heavy rainfall, snowmelt and coastal storm surges can cause flooding, exacerbated by ice-jam blockages. Rising sea levels also pose long-term challenges for its coastal towns and harbors.
FEMA map coverage is low at 50%, and 31.1% of the maps are more than 10 years old. Currently, 67.4% of average annual loss (AAL) sits outside the FEMA SFHA.
Financial
Coverage
Exposure
Infrastructure
Maryland

Located in the Mid-Atlantic region, Maryland has a long shoreline and a rapidly growing population.
- Total Area: 12,406mi²
- Population: 6.3m
- Capital: Annapolis
Maryland, in the Mid-Atlantic region, has diverse geography, including the Chesapeake Bay, coastal plains and the Appalachian Mountains in the west. It has a humid subtropical climate, with hot summers and mild winters in the east, while the west experiences colder temperatures. The economy is driven by government, biotechnology and shipping.
Sixteen of Maryland’s 23 counties border the tidal Chesapeake Bay estuary and its tributaries, where flooding is a concern. Hurricanes, river flooding and urban flash flooding in its major cities add to the risk.
The increase in average annual losses due to flood from 2020 to 2050 is 37.9% – above the national average of 27.6%. Currently, 40.9% of losses sit outside the FEMA SFHA.
Financial
Coverage
Exposure
Infrastructure
Massachusetts

Bordering the Atlantic Coast and the Gulf of Maine to the east, the ‘Bay State’ has more than 1,500 miles of coastline.
- Total Area: 10,554mi²
- Population: 7.1m
- Capital: Boston
Massachusetts in New England is known for its coastline but also has rolling hills and the Berkshire Mountains. It has a humid continental climate, with cold winters and warm summers, though coastal areas are moderated by the Atlantic Ocean.
The economy is fueled by technology, finance, and higher education, particularly in Boston. The state faces flood risks from nor’easters, hurricanes and heavy inland rainfall.
FEMA map coverage is reasonably good at 83.4%, but 74.5% of the maps are more than 10 years old. An estimated $602.3m in average annual losses (73.3%) currently occur outside the FEMA SFHA, which indicates that a significant amount of risk could be overlooked.
Financial
Coverage
Exposure
Infrastructure
Michigan

A peninsular US state, surrounded by the Great Lakes. Michigan also contains approximately 65,000 inland lakes and ponds.
- Total Area: 96,714mi²
- Population: 10.1m
- Capital: Lansing
Michigan has a varied landscape of forests, inland lakes and flat plains. Approximately 42% of the state is covered with water, the highest water coverage by percentage in the US. It has a humid continental climate, with cold, snowy winters and warm summers.
One of the most populous and largest metropolitan economies in the US is the Metro Detroit region, located in Southeast Michigan. The economy is centered on automobile manufacturing, agriculture and tourism.
Flooding in Michigan occurs mainly along rivers due to heavy rain and snowmelt. Around 77.9% of the state is covered by FEMA maps and 57% of those are more than 10 years old. An estimated 74.1% of average annual financial losses, amounting to $442.1m, sits outside the FEMA SFHA.
Financial
Coverage
Exposure
Infrastructure
Minnesota

Upper Midwest state Minnesota is known as ‘the Land of 10,000 Lakes’.
- Total Area: 86,936mi²
- Population: 5.8m
- Capital: Saint Paul
Minnesota, in the Upper Midwest, borders Lake Superior, the source of the Mississippi. It is known for its thousands of lakes and rolling plains, and about a third of the state is covered in forest. Its climate is humid continental, with harsh winters and warm summers, and it experiences a wide variety of meteorological events including snow, blizzards, thunderstorms, hail, tornadoes and high-velocity straight-line winds.
Flood risks stem from snowmelt, heavy spring rains and river overflow, particularly along the Red River and Mississippi River.
Of the current average annual financial losses due to flooding, 75.6% come from outside the FEMA SFHA. Only 57.8% of the state is covered by FEMA maps, and 44.2% of those are older than 10 years.
Financial
Coverage
Exposure
Infrastructure
Mississippi

Bordering the Mississippi River to the west and the Gulf of Mexico to the south, the state is expected to see a big increase in population exposure to floods.
- Total Area: 48,432mi²
- Population: 2.9m
- Capital: Jackson
The state of Mississippi has flat plains, rolling hills, and forming its western border is the Mississippi River, the primary river of the largest drainage basin in the US. It has a humid subtropical climate, with long, hot summers and mild winters, and an economy that relies heavily on agriculture, manufacturing, and energy.
The state faces high flood risks from heavy rainfall, coastal storm surges. It is expected to see a significant (184%) increase in average annual population exposure to flood by 2050 (compared with the national average 97.3%), and the increase in average annual losses due to flood is estimated at 31.6%, also above the national average of 27.6%.
FEMA maps cover 100% of the state, but 85.5% of them are more than 10 years old.
Financial
Coverage
Exposure
Infrastructure
Missouri

Missouri features mountains and major rivers while the flat southeastern region is part of the Mississippi Alluvial Plain.
- Total Area: 69,707mi²
- Population: 6.2m
- Capital: Jefferson City
Flooding is a major concern in Missouri, a central US state that has a landscape ranging from rolling plains and forests to the Ozark Mountains in the south. Its economy is supported by agriculture, manufacturing, and transportation, with major cities like St Louis and Kansas City serving as economic hubs.
The state experiences a humid continental to humid subtropical climate, with hot summers, cold winters, and frequent severe storms that cause flash floods. Flooding is also common along the Missouri and Mississippi Rivers, where heavy spring rains and snowmelt frequently cause overflows.
The largest city, Kansas City, is experiencing major population growth, and the state as a whole is expected to see a 122% increase in average annual population exposure by 2050. Currently, 46.6% of average annual financial losses sit outside the FEMA SFHA. FEMA map coverage of the state is 90.4%, but 74.4% of the maps are older than 10 years.
Financial
Coverage
Exposure
Infrastructure
Montana

A landlocked state in the northern Rocky Mountains region, with a burgeoning tourism industry.
- Total Area: 147,040mi²
- Population: 1.1m
- Capital: Helena
The western half of Montana contains several mountain ranges, while the eastern half features prairies and badlands. Its large river systems include the Yellowstone and Missouri Rivers. The state has a varied climate, with cold, snowy winters and warm, dry summers. Montana’s economy is based on agriculture, mining and its fastest growing sector, tourism, particularly in national parks such as Glacier.
Flood risks are primarily linked to rapid snowmelt from the Rocky Mountains and heavy rain and ice jams.
Currently, 82.5% of average annual losses due to flooding sit outside the FEMA SFHA. That puts the state at no. 2 in the index for this metric. It also has low flood data coverage: FEMA map coverage is at 60.1% and 74% of those maps are more than 10 years old, and LiDAR coverage is 15.4%, the second lowest in the index.
Financial
Coverage
Exposure
Infrastructure
Nebraska

A west-central US state with the Great Plains at its center. Much of the population lives near the rivers Missouri and Platte.
- Total Area: 77,348mi²
- Population: 2m
- Capital: Lincoln
Nebraska is made up of two major land regions: the Dissected Till Plains and the Great Plains. Overall, the state is flat, with rolling hills and the Sandhills region in the west. It also has two climates: the eastern two-thirds of the state has a humid continental climate, while western Nebraska is semi-arid. Agriculture, especially corn and cattle farming, is central to its economy.
Flood risk is driven by heavy rain, snowmelt and river overflows along the Platte and Missouri Rivers.
The average annual population exposed to flood is expected to increase by 145% between 2020 and 2050. Currently, 51.2% of average annual losses happen outside the FEMA SFHA. FEMA maps cover just 63% of the state, and 84.2% of those are more than 10 years old.
Financial
Coverage
Exposure
Infrastructure
Nevada

Nevada is a mountainous, sparsely populated region, with semi-arid grasslands and sandy alkali deserts.
- Total Area: 110,572mi²
- Population: 3.3m
- Capital: Carson City
Nevada is characterized by vast deserts, rugged mountain ranges and arid plateaus. The Great Basin dominates much of its geography, with the Sierra Nevada mountains to the west and the Mojave Desert in the south. The state has an arid to semi-arid climate, with scorching summers and cold winters, especially in higher elevations.
Rainfall is minimal, but flash flooding can occur during the monsoon season and as a result of mountain snowmelt and arid-region run-off. Particularly vulnerable are urban areas such as Las Vegas, where stormwater can rapidly overwhelm drainage systems.
Although 98% of the state is covered by FEMA maps, Nevada ranks no. 1 in the index for the highest percentage –99.5% – of FEMA maps that are over 10 years old. Currently, 70.5% of average annual financial losses sit outside the FEMA SFHA.
Financial
Coverage
Exposure
Infrastructure
New Hampshire

New England state known for its vast wilderness areas, with a fast-growing tourism sector.
- Total Area: 9,349mi²
- Population: 1.4m
- Capital: Concord
New Hampshire, in New England, has rugged mountains, dense forests and a short Atlantic coastline. The state has five main drainage basins, the largest being the Merrimack River, in the center. Others are the Connecticut River drainage basin and the Saco, Piscataqua and Androscoggin coastal rivers.
The state has a humid continental climate, with cold, snowy winters and warm summers. Flood risks stem from heavy rainfall, snowmelt and coastal storm surges, especially in spring.
While FEMA map coverage is good at 97.4%, New Hampshire has the second-highest percentage (97.2%) of maps that are older than 10 years. Currently, 80.1% of average annual financial losses occur outside the FEMA SFHA, which indicates that a significant amount of risk could be overlooked.
Financial
Coverage
Exposure
Infrastructure
New Jersey

The most densely populated state in the US. New Jersey has seen rapid growth and urbanization.
- Total Area: 8,723mi²
- Population: 9.5m
- Capital: Trenton
New Jersey, in the Mid-Atlantic region, has diverse geography, including coastal plains, the Pine Barrens, and the Appalachian Highlands. It has a humid subtropical climate, with hot, humid summers and cold winters. The economy is driven by pharmaceuticals, finance, and transportation, with major urban centers near New York City and Philadelphia.
Flooding is driven by hurricanes and nor’easters, especially along the Jersey Shore. Heavy rainfall causes flooding in urban areas and along rivers such as the Passaic and Raritan.
The state is experiencing rapid urbanization, and the average annual population exposure to flood is expected to rise by 164% between 2020 and 2050. Currently 5.7% of road network is at risk, rising to 7% by 2050. Average annual losses due to flood are expected to rise by 45.8%, well above the national average of 27.6%.
Financial
Coverage
Exposure
Infrastructure
New Mexico

Fifth largest state by area, but one of the most sparsely populated, New Mexico has become increasingly urbanized.
- Total Area: 121,590mi²
- Population: 2.1m
- Capital: Santa Fe
New Mexico, in the southwestern US, features deserts, high plateaus and mountain ranges. It has a dry, arid to semi-arid climate, with hot summers and mild winters, though higher elevations experience snowfall.
Flash floods occur in desert areas due to heavy monsoon rains, snowmelt and arid region runoff, particularly in arroyos and dry riverbeds.
With increasingly severe and frequent weather events, coupled with population growth and movement, an estimated 124% increase in average annual population exposure is expected by 2050 (the national average is 97.3%).
Only 77.6% of the state has FEMA map coverage, and 86.3% of those are more than 10 years old. Currently, more than 66% of average annual financial losses sit outside the FEMA SFHA.
Financial
Coverage
Exposure
Infrastructure
New York

The fourth-most populous state, development and population growth amplifies New York’s flood risk.
- Total Area: 54,555mi²
- Population: 19.9m
- Capital: Albany
Outside of New York City, most of New York state is covered by farmland, forests, rivers, mountains and lakes. It has a humid continental climate, with cold winters and warm summers, while New York City has a milder coastal influence.
Flood risks, exacerbated by population growth and urbanization, include urban surface water flooding, coastal flooding from hurricanes and rising sea levels and river flooding driven by heavy rainfall and snowmelt. New York City has a significant amount of real estate built on low-lying land, which is particularly vulnerable to flooding.
The state will see a 18.8% increase in average annual financial losses, reaching almost $1.7bn by 2050. This accounts for 4.5% of national losses. Currently, 64% of these losses sit outside the FEMA SFHA, accounting for £985.8m.
New York has low FEMA map coverage at 51.9%, with 73.1% of those maps more than 10 years old.
Financial
Coverage
Exposure
Infrastructure
North Carolina

A southeastern state with an Atlantic coastline. Inland and coastal flooding from hurricanes is a major risk.
- Total Area: 53,819mi²
- Population: 11m
- Capital: Raleigh
The southeastern state of North Carolina has a humid subtropical climate and its geography is a mix of mountains, rolling hills and a long Atlantic coastline. It has approximately 3,820 sq miles of inland water, the third largest in the US, and the coastal plain makes up almost half the state.
The state faces major flood risks from hurricanes, coastal storm surges and heavy rain. Inland flooding from tropical storms is also a frequent hazard. During Hurricane Helene in 2024, for example, rainfall in western North Carolina reached more than 31 inches in some areas.
The state will see a 116% increase in average annual population exposure to flooding by 2050, and a 33.8% increase in average annual financial losses. Currently, 41% of those losses sit outside the FEMA SFHA.
North Carolina is well mapped by FEMA, with 99.5% coverage. However, 76.7% of those maps are more than 10 years old.
Financial
Coverage
Exposure
Infrastructure
North Dakota

Upper Midwest state bordering Canada to the north. North Dakota is the fourth most sparsely populated state.
- Total Area: 70,698mi²
- Population: 796.6k
- Capital: Bismarck
The fourth-least populated state in the US, and the fourth most sparsely populated, North Dakota is characterized by rolling plains, the Badlands and the Red River Valley. Rich in fossil fuels and mineral resources, Dakota has a continental climate, with very cold winters and warm summers, and an economy based on agriculture, energy production and manufacturing.
Flood risks are significant along the Red River due to snowmelt, heavy rainfall and spring ice jams.
North Dakota is expected to see a 221% rise in average annual population exposure by 2050, well above the national average of 97.3%. This puts it at no. 3 in the index for population exposure increase.
Currently, 72.1% of average annual losses sit outside the FEMA SFHA. The state has low FEMA map coverage at 61.2%, with 66.4% of those maps at 10 years old, and it has low LiDAR coverage of 37.3%.
Financial
Coverage
Exposure
Infrastructure
Ohio

Bounded by the Ohio River to the south, the state has a well-developed road network linking the Northeast to the Midwest.
- Total Area: 44,826mi²
- Population: 11.9m
- Capital: Columbus
Ohio features flat plains and rolling hills and has a humid continental climate. The state is known for its manufacturing industries, particularly in the automotive, aerospace and steel sectors. It also ranks among the top states in the production of corn, soybeans and dairy products.
Flood risks in Ohio are exacerbated by the state’s relatively flat topography in certain regions and its location within the Ohio River Basin. The risks are primarily associated with heavy spring rainfall and rapid snowmelt.
FEMA map coverage is at 97.1%, but 86.9% of those maps are more than 10 years old. Current average annual losses are $1bn, with 49.2% of those losses occurring outside the FEMA SFHA. By 2050, 8.1% of Ohio’s road network and 10.5% of its rail network will be at risk of flooding.
Financial
Coverage
Exposure
Infrastructure
Oklahoma

Oklahoma is a geographically diverse state and home to the nation’s highest number of artificial reservoirs.
- Total Area: 69,899mi²
- Population: 4.1m
- Capital: Oklahoma City
Most of Oklahoma lies in the Great Plains, Cross Timbers and the Interior Highlands. It features prairies, forests, wetlands, ancient mountains and the Ozark Plateau in the northeast, and it has a continental climate, with hot summers, cold winters and frequent severe storms.
Oklahoma has more than 500 named creeks and rivers and 200 lakes formed by dams. The majority of the state falls within two major drainage basins, those of the Red and Arkansas Rivers. River flooding and flash floods from intense thunderstorms are a risk.
The average annual population exposure to flood is expected to increase by 154% by 2050 (national average is 97.3%).
Currently, 64.4% of average annual losses due to floods sit outside the FEMA SFHA. FEMA map coverage is 77.1%, with 86% of those more than 10 years old.
Financial
Coverage
Exposure
Infrastructure
Oregon

One of the most geographically diverse states in the US, ranging from volcanoes, to rainforests, deserts and semi-arid shrublands.
- Total Area: 98,379mi²
- Population: 4.3m
- Capital: Salem
Oregon has a diverse landscape and experiences a temperate climate, characterized by wet winters and dry summers in its western regions, while the eastern parts are generally drier.
Oregon’s economy is powered by a thriving technology sector, various forms of agriculture, logging and hydroelectric power. The state is the top lumber producer of the contiguous US.
The western part of Oregon receives heavy rainfall, which, combined with snowmelt in the spring, can result in flooding in low-lying areas and river valleys. The eastern part of the state can also experience flash floods due to thunderstorms and rapid snowmelt.
FEMA map coverage is low, at only 54.2%, and 65.4% of the maps are more than 10 years old. LiDAR coverage is also low, at 33.1%. Currently, 71.9% of average annual losses occur outside the FEMA SFHA, accounting for $653.5m.
Financial
Coverage
Exposure
Infrastructure
Pennsylvania

The Mid-Atlantic state is a major harbor on the Delaware River and one of the world’s busiest shipping hubs.
- Total Area: 46,054mi²
- Population: 13.1m
- Capital: Harrisburg
Pennsylvania, in the Mid-Atlantic, features mountains, forests, and river valleys, including the Susquehanna and Delaware Rivers. It has a humid continental climate. Western areas of the state, particularly near Lake Erie, can receive more than 100 inches (250 cm) of snowfall annually, and the entire state receives abundant precipitation.
Flood risk is high along the river Susquehanna, where heavy rainfall and snowmelt can lead to inundation.
Currently, 60% of its $2.8bn average annual losses occur outside the FEMA SFHA. The state ranks no. 1 in the index for the length of the rail network currently at risk of flood (1,384 miles). By 2050, 7.5% of the road network will be at risk of flooding. FEMA map coverage is good at 99%, but 64% of those are more than 10 years old.
Financial
Coverage
Exposure
Infrastructure
Rhode Island

Rhode Island in New England is the smallest state in the US. It is largely flat, coastal and vulnerable to hurricanes and flooding.
- Total Area: 1,545mi²
- Population: 1.1m
- Capital: Providence
Rhode Island has a long Atlantic coastline with bays and inlets, earning it the nickname “Ocean State”. It is only 37 miles wide and 48 miles long, but it has a tidal shoreline of 384 miles.
It has a humid continental climate, with cold winters and warm summers. Narragansett Bay, which includes 30 islands, is a major feature of the state’s topography.
The state’s location makes it vulnerable to coastal flooding from heavy rain, hurricanes and nor’easters.
Between 2020 and 2050, Rhode Island is expected to see a 23.1% increase in average annual losses due to flood. Currently, 53.5% of losses are found outside the FEMA SFHA.
FEMA map coverage is 100%, but nearly 50% of the maps are more than 10 years old.
Financial
Coverage
Exposure
Infrastructure
South Carolina

Located on the southern Eastern Seaboard, South Carolina’s coastal location and humid climate make it vulnerable to flooding.
- Total Area: 32,020mi²
- Population: 5.5m
- Capital: Columbia
The landscape of South Carolina in the southeastern US encompasses coastal plains, marshes and beaches along the Atlantic coastline, rolling hills and the Piedmont and Blue Ridge Mountains. Its climate is humid subtropical, with hot summers and mild winters.
With its low-lying topography, FEMA has identified areas at risk of flood in every county, city and town in South Carolina. Flood risk is largely driven by hurricanes, heavy rain, storm surges and river flooding.
The state has experienced rapid urbanization, especially in the coastal city of Charleston. The expected increase in average annual population exposure to flood by 2050 is 162% (the national average is 97.3%).
The increase in average annual losses from flood is also significant at 58.4% between 2020 and 2050, well above the national average of 27.6%. FEMA map coverage is almost 100%, but of those maps, 64.4% are more than 10 years old.
Financial
Coverage
Exposure
Infrastructure
South Dakota

US state in the North Central region. Four of the six large dams on the Missouri River are at least partially located in South Dakota.
- Total Area: 77,116mi²
- Population: 924.7k
- Capital: Pierre
South Dakota’s landscape features plains and rolling prairies, the pine-covered Black Hills and the Missouri and Big Sioux rivers. It has a continental climate, with cold winters and warm summers and precipitation levels ranging from moderate in the east to semi-arid in the west.
South Dakota’s economy, once largely focused on agriculture, has become more diverse in recent decades, with the tourism and financial sectors growing considerably since the mid-20th century.
Flood risk is driven by snowmelt, heavy rainfall and river overflow, particularly along the Missouri.
The state has the fourth-biggest increase in average annual population exposure by 2050, at 215% (national average is 97.3%).
It has low FEMA map coverage at 58.2%, and 93.9% of those are more than 10 years old. Only 26% of current average annual financial losses occur within the FEMA SFHA.
Financial
Coverage
Exposure
Infrastructure
Tennessee

Landlocked state trisected by the Tennessee River and with the Mississippi River forming its western border.
- Total Area: 42,144mi²
- Population: 7.2m
- Capital: Nashville
The southeastern state of Tennessee is divided into three geographic regions: East, Middle, and West Tennessee. The boundary between the Eastern and Central Time zones passes across the Cumberland Plateau through the state.
Tennessee, which has a humid subtropical climate, has the Mississippi along its western border and the Blue Ridge Mountains, which reach some of the highest elevations in eastern North America, forming its boundary to the east.
Flood risks come from heavy rainfall and overtopping of the Tennessee and Cumberland Rivers.
It has almost 100% FEMA map coverage, but 92.5% of those maps are older than 10 years. Currently, 71% of average annual financial losses occur outside the FEMA SFHA, which indicates that a significant amount of risk could be overlooked.
Financial
Coverage
Exposure
Infrastructure
Texas

The second-largest US state after Alaska. Texas takes up 7% of the total water and land area of the US.
- Total Area: 268,596mi²
- Population: 31.3m
- Capital: Austin
Texas, in the South Central region of the US, has 10 climatic regions, 14 soil regions and 11 ecological regions. It has a vast network of water bodies comprising 3,700 named streams and 15 major river systems all coursing through 191,000 miles of the state and supporting more than 212 reservoirs.
Flooding is a major concern, especially from hurricanes and intense rainfall. Flash flooding is also common due to rapid runoff.
Texas ranks no. 1 for the longest length of road network at risk of flood (2,525 miles) and no. 2 for the length of rail network at risk (1,221 miles).
The state will see an estimated 46.6% increase in average annual financial losses between 2020 and 2050 – above the national average of 27.6%. These losses are expected to reach more than $2bn, accounting for 5.6% of national losses. Currently, nearly 54% of average annual losses sit outside the FEMA SFHA.
The increase in average annual population exposure by 2050 is also significant at 185%, compared with a national average of 97.3%. FEMA map coverage is low, at 53.7%, and 77.5% of those are more than 10 years old.
Financial
Coverage
Exposure
Infrastructure
Utah

Landlocked state in the Mountain West subregion, with one of the fastest-growing populations in the US.
- Total Area: 84,897mi²
- Population: 3.5m
- Capital: Salt Lake City
Known for its natural diversity and rugged beauty, Utah is a rapidly growing and urbanizing state in the western US. Its varied terrain ranges from deserts to pine forests and mountains including those in the Wasatch Range, which reaches almost 12,000 ft above sea level.
The state’s location in the rain shadow of the Sierra Nevada in California contributes to its arid to semi-arid climate and low precipitation levels. While droughts are becoming more frequent and severe, flood risks are relatively low in Utah. However, they can occur from rapid snowmelt, heavy monsoon rain and desert run-off.
Utah is no. 1 in the index for the highest proportion of average annual losses – 87% – that sit outside the FEMA SFHA. FEMA map coverage is only 50% and nearly 94% of those maps are more than 10 years old.
Financial
Coverage
Exposure
Infrastructure
Vermont

Vermont is the only landlocked state in New England, and second-least populated state in the country.
- Total Area: 9,616mi²
- Population: 648.5k
- Capital: Montpelier
New England state Vermont is known for the Green Mountains, which run north-south through the middle. Most of the terrain is forested with pines and hardwoods.
The economy relies on agriculture, tourism, and manufacturing, and it has the highest proportion of renewable energy in the US, at 99.9%. Vermont is the only state with no buildings taller than 124 feet.
Flooding is a concern due to heavy rainfall, snowmelt, and flooding from major rivers such as the Connecticut.
Currently, 59.1% of average annual financial losses sit outside the FEMA SFHA. For the percentage of road network at risk, Vermont ranks no. 4 in the index at 9.2%. FEMA map coverage is low at 64.7%, and nearly 84% of those are more than 10 years old.
Financial
Coverage
Exposure
Infrastructure
Virginia

Situated between the Atlantic Coast and the Appalachian Mountains, Virginia is home to the world’s largest naval base.
- Total Area: 42,775mi²
- Population: 8.8m
- Capital: Richmond
Virginia, in the Southeastern and Mid-Atlantic regions of the US, has a long coastline along the Atlantic Ocean. Eastern Virginia is part of the Atlantic Plain, while the Middle Peninsula forms the mouth of the Chesapeake Bay. The central portion of the state lies mainly in the foothills of the Blue Ridge Mountains.
With its humid subtropical climate, flood risks stem from hurricanes, tidal surges and river flooding.
FEMA map coverage of Virginia is around 99% but nearly 69% of those are more than 10 years old. Currently, 49.3% of average annual financial losses due to floods sit outside the FEMA SFHA, accounting for $436.7m. The state’s average annual loss (AAL) is expected to rise by 19.3% between 2020 and 2050, taking it over the $1bn mark.
Financial
Coverage
Exposure
Infrastructure
Washington

The most northwestern state, Washington has the second highest population in the Western US after California.
- Total Area: 71,298mi²
- Population: 8m
- Capital: Olympia
Washington state is in the Pacific Northwest, with the Pacific Ocean as its western border and its northern border lying mainly along the 49th parallel. The state’s economic engine and main population hub is the Seattle Metropolitan area, located in Puget Sound, an inlet of the Pacific Ocean with many islands, fjords and bays.
The geography of the rest of the state is diverse, with temperate rainforests, mountain ranges and a semi-arid basin region as well as its long coastline. It has a temperate maritime climate in the west and a drier inland climate.
Flooding occurs as a result of heavy rainfall and snowmelt while coastal areas face storm surges and rising sea levels.
Washington ranks as no. 5 in the index for the highest percentage (78.7%) of current average annual financial losses that occur outside FEMA SFHA, accounting for $1.2bn.
Only 57.7% of the state is covered by FEMA maps and 54.4% of those are more than 10 years old. It also has relatively low LiDAR coverage at 60.3%.
Financial
Coverage
Exposure
Infrastructure
West Virginia

Nicknamed the ‘Mountain State’, West Virginia is located entirely in the Appalachian region.
- Total Area: 24,230mi²
- Population: 1.8m
- Capital: Charleston
West Virginia is frequently included in several US geographical regions, including the Upland South, the Southeastern US and the Mid-Atlantic. The state is covered almost entirely by mountains, with the average elevation in the state approximately 1,500 ft above sea level, and large rivers include the Ohio, the New River and the Shenandoah.
The state has a humid continental climate, and experiences some of the most frequent precipitation in the nation – the Snowshoe area averages close to 200 days a year with either rain or snow. Flash flooding is a frequent issue, due to heavy rainfall and snowmelt in mountainous areas.
With over 37,300 miles of public roads, the state ranks no. 1 for the highest percentage of road network currently at risk of flood – currently at 17.4%, rising to 18.1% by 2050. It also ranks no. 3 for the longest length of rail network currently at risk (828 miles), accounting for nearly 29.2% of the network.
While FEMA map coverage is 100%, it is among the top 5 states with the highest percentage (92.5%) of FEMA maps over 10 years old. Currently, 58.5% of average annual financial losses due to floods sit outside the FEMA SFHA ($957.5m).
Financial
Coverage
Exposure
Infrastructure
Wisconsin

A heavily forested midwestern US state in the Great Lakes region.
- Total Area: 65,496mi²
- Population: 6m
- Capital: Madison
Wisconsin, in the Midwest US, has more than 500 miles of Great Lakes coastline, with borders on Lake Superior in the north and Lake Michigan to the east. The interior terrain is mostly a mix of vast forests, glacial lakes and rolling farmland.
It has a humid continental climate, and has a large amount of snowfall, averaging up to 160 inches in the Lake Superior snowbelt each year. Flooding is common along rivers such as the Mississippi and Wisconsin, driven by snowmelt and heavy rain.
FEMA map coverage of the state is 90.1% but 83.1% of those are more than 10 years old. 78% of current average annual financial losses occur outside the FEMA SFHA, which indicates that a significant amount of risk could be overlooked.
Financial
Coverage
Exposure
Infrastructure
Wyoming

The least populated state in the US, Wyoming is where the Great Plains meet the Rocky Mountains.
- Total Area: 97,813mi²
- Population: 587.6k
- Capital: Cheyenne
Wyoming, home to Yellowstone National Park, consists mostly of the Rocky Mountains in the west and the prairies of the High Plains in the east. Wyoming’s climate is semi-arid in some parts and continental in others, making it drier and windier overall than other states, with greater temperature extremes.
Several rivers begin in or flow through the state, including the Yellowstone River, Bighorn River, Green River, and the Snake River. Flash flood risks are mainly driven by snowmelt, ice jams and heavy rain in mountainous regions.
The expected increase in average annual population exposure to flood by 2050 is 125% (the national average is 97.3%).
There is low FEMA map coverage of the state at 65.7%, and nearly 67% of those are more than 10 years old. Currently, almost 79% of average annual financial losses due to floods sit outside the FEMA SFHA, which indicates that a significant amount of risk could be overlooked.
Financial
Coverage
Exposure
Infrastructure
Understanding flood risk in the US
Flood risk in the US is rising, amplified by more frequent and extreme weather events and population growth. The financial toll of flooding, according to Fathom’s research, is estimated at $32.1bn currently, and this could rise by more than a quarter by 2050 due to evolving weather patterns alone.
At the same time, population changes and urbanization far outweigh those impacts as more people live in areas at risk of flooding. The research found that even with no future changes in flood hazard, the average annual exposure of the population will increase by 72.6% to 6.27 million by 2050.
Identifying, managing and mitigating the impacts of flood risk, both now and in the future, is crucial for delivering successful infrastructure projects and building resilience in communities across the US.
Key findings: What the figures tell us about flood risk
Financial losses
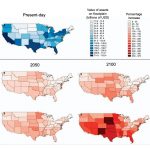
The index shows the average annual losses (AAL) i.e. how much you can expect to lose financially each year due to property damage from flooding, and how they are projected to change between 2020 and 2050.
The average rise in AAL nationally is around 28%, but some states are seeing much higher projected flood losses. The states with the biggest increases are Louisiana (147% increase), Florida (73.6%), South Carolina (58.4%) and Texas (46.6%).
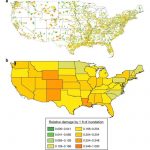
Financial losses outside FEMA’s SFHA
The index shows us that in most states, more than half of the average annual losses occur outside FEMA’s Special Flood Hazard Areas (SFHA) – the area in which the National Flood Insurance Program’s (NFIP) floodplain management regulations must be enforced and mandatory purchase of flood insurance applies (to residential homeowners with a federally-backed mortgage).
This means that a high level of projected losses will occur in places where flood insurance is not mandatory and exposure could be underestimated.
Coverage of flood data
Up-to-date, reliable data is crucial for preparing for flood risk. Most states have reasonably high LiDAR and FEMA Flood Rate Insurance Map (FIRM) coverage. However, flood maps produced by FEMA currently only cover approximately 60% of the continental US, and only 19% is covered by maps less than 10 years old.
States with the lowest FEMA map coverage include Idaho (33.1%), Utah (50%), Maine (50%), New York (51.9%), Kansas (52.6%) and Texas (53.7%).
States with the highest % of FEMA maps that are more than 10 years old include Nevada (99.5%), New Hampshire (97.2%), Arizona (94.3%), South Dakota (93.9% and Utah (all 93.6%).
Population exposure
Financial losses only tell part of the picture; they do not capture the human cost of flooding. The US population projected to be exposed to flooding annually is due to rise by 97% by 2050, and the impacts of rapid urbanization and population growth coupled with an increase in extreme weather events mean that the majority of US states will see a rise in average annual population exposure to flood.
The states with the highest increase in population exposure between 2020 and 2050 include Iowa (276%), Georgia (236%), North Dakota (221%), South Dakota (215%) and Kansas (204%).
Road and rail infrastructure
The US road and rail networks are the backbone of the US’s critical infrastructure, and both are vulnerable to extreme weather conditions. Currently, 5.36% (23,752 miles) of the US road network and 9.15% (18,172 miles) of the rail network is at risk of flood.
This is expected to rise. By 2050, the states with the highest percentage of road network at risk include West Virginia (18.1%), District of Columbia (14.7%) and Louisiana (12.4%). For rail this is West Virginia (30.3%), Pennsylvania (19.4%) and Vermont (16.3%).

Data briefing: Fathom’s US Flood Risk Index
Fathom’s Prof Paul Bates PRCS CBE and Peter Slater will be holding a 30-minute session to introduce you to the US Flood Risk Index. Register to understand the risk in your state and how to drive adaptation strategies while learning more about the research behind the data.

Related research
Validation of a 30m resolution flood hazard model of the conterminous United States
Inequitable patterns of US flood risk in the Anthropocene
Attributable human-induced changes in the magnitude of flooding in the Houston, Texas region during Hurricane Harvey
Benchmarking urban flood models of varying complexity and scale using high resolution terrestrial LiDAR data
Combined Modeling of US Fluvial, Pluvial, and Coastal Flood Hazard Under Current and Future Climates
A flood inundation forecast of Hurricane Harvey
Estimates of present and future flood risk in the conterminous United States
New insights into US flood vulnerability revealed from flood insurance big data
Social inequalities in climate change-attributed impacts of Hurricane Harvey
The spatial dependence of flood hazard and risk in the USA
Uneven burden of urban flooding
Flood exposure and social vulnerability in the United States
Increased Flood Exposure Due to Climate Change and Population Growth in the United States
A benefit-cost analysis of floodplain land acquisition for US flood damage reduction
Federally overlooked flood risk inequities in Houston, Texas
Rainfall-driven flood risk from hurricanes in Puerto Rico under climate change
Sources and methodology
Financial metrics
- Average annual loss (AAL) is a key metric used to assess flood risk. It estimates the expected financial loss from flooding over a typical year, considering the probability and severity of potential flood events*. The Flood Risk Index calculates both the 2020 and 2050 AAL, which is important for understanding how flood risk is expected to change over time, in light of changing weather patterns. We have also analyzed which proportion of the AAL occurs within and outside FEMA special flood hazard areas (SFHA). This shows how much – or how little – of the risk is covered by official flood maps (see Exposure Metrics below). Data availability and methodology are available here. *Financial losses are aggregated by taking random samples from property-level AAL distributions. Different AAL statistics may not sum exactly due to sample error and rounding when aggregated, so care must be taken when combining individual aggregate statistics.
Coverage metrics
- FEMA Flood Insurance Rate Map (FIRM) coverage shows the percentage of the state covered by FEMA data. This provides valuable insights into flood risk management, insurance considerations and community resilience.
- The age of a FEMA FIRM is also crucial because it directly impacts the accuracy and reliability of flood risk assessments. FEMA recommends reviewing and updating maps every five years. We have analyzed the ages of all available maps and classified them as either under 10 years old or more than 10 years old. Those with an unknown age are discounted. Data source: FEMA. Analysis undertaken in 2024.
- Light Detection and Ranging (LiDAR) coverage: LiDAR uses laser pulses to create detailed, high-resolution maps of the Earth’s surface, capturing precise elevation data. It enhances flood modeling, supports the updating of FEMA FIRM, aids in designing effective flood defenses and helps track environmental changes over time. Additionally, LiDAR data is valuable for identifying property-level flood risks and assisting in disaster recovery efforts by providing detailed, high-resolution elevation information. Analyzing how much of a state is covered by LiDAR helps understand the flood risk. This dataset was analysed in 2023 and combines high-quality, open-source data, primarily from the USGS sources (USGS 3DEP (3D Elevation Program) and USGS OPR (Original Product Resolution)) and from state sources, where feasible.
Exposure metrics
- AAL within/outside FEMA SFHA: We analyze how much of a state’s total AAL falls within, and outside, the FEMA SFHA. This helps determine if flood risk management, insurance strategies and mitigation efforts align with actual risk patterns, rather than just those defined by existing maps. If significant losses occur outside SFHAs, it suggests potential gaps in mapping, insurance coverage and mitigation. Data availability and methodology are available here.
- Average annual population exposure shows the estimated population exposed to flood risk each year by analyzing current and future flood maps (all return periods) against current and future population data. Population growth and rapid urbanization are the biggest drivers of increasing flood risk in the US. Understanding the anticipated increase in average annual population exposure helps prepare for the impacts of climate change, urbanization and demographic shifts on flood risk and supports more effective flood mitigation, insurance strategies, and infrastructure planning. Data availability and methodology are available here.
- Road and rail network at risk of flood: These metrics indicate the percentage and length of the road and rail network at risk of direct impact from 15cm+ of coastal, fluvial or pluvial flooding (1-in-100 year return period). A 15cm rise in floodwater is considered the threshold at which a road becomes at high risk, disrupting vehicle mobility, damaging road infrastructure, overwhelming drainage systems and causing safety hazards for both traffic and pedestrians. The same 15cm rise in floodwater is considered a high-risk threshold for rail networks due to its impact on track beds, signaling systems, train performance (breaks, engines, electrical components) and the presence of debris on the track. These data were derived from the U.S. Department of Transportation’s North America Roads geospatial dataset (2024) and the U.S. Department of Transportation’s North America Rail Network Lines dataset (2025), combined with Fathom’s US Flood Map.
- State area and population data available from Census.gov.
About Fathom
Founded in 2013, Fathom gives risk management professionals the most scientifically robust intelligence for understanding the climate’s effects on water risk. By publishing cutting-edge peer-reviewed academic research and applying it to real-world challenges, Fathom enables stronger decision-making for (re)insurance, civil engineering, corporate risk, financial services, disaster response and government.
As a dedicated team of scientists, Fathom harnesses its passion for innovation and the environment to develop rigorous catastrophe models and comprehensive mapping and geospatial data that make a real-world difference to customers and communities worldwide.