
St. Louis Urban Assessment Tool
Fathom data gave The Nature Conservancy the accuracy they needed to reveal hotspots of flood risk in disadvantaged neighborhoods.
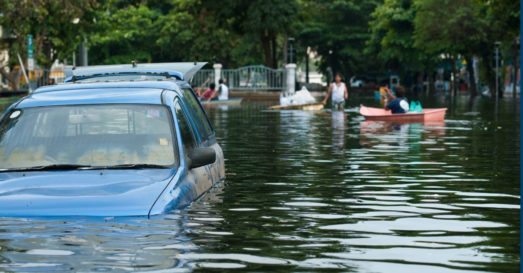
Flood risk is not borne equally by all. Evidence from around the world shows that disadvantaged communities are often the most likely to face floods
Recent research led by Fathom’s scientists, for example, reveals that the most impoverished communities are at the greatest risk of flooding in the US. Further, future climate change-driven increases in flood risk will be disproportionately felt by African American communities.
Knowing which communities are most vulnerable to flood can shape risk management interventions and help get investment to where it is most needed.
In 2021, The Nature Conservancy (TNC), a not-for-profit environmental organisation, launched the St. Louis EcoUrban Assessment tool. This online tool reveals which communities are most at risk of flooding at a very local level in the region of St. Louis, USA.
It presents a series of maps that show how vulnerable each neighborhood is to environmental burdens
These include flooding, but also air pollution and toxic waste. Access to amenities, such as parks and food stores, is also shown. Moreover, the tool highlights inequalities by displaying the racial composition and average household income level of each neighborhood.
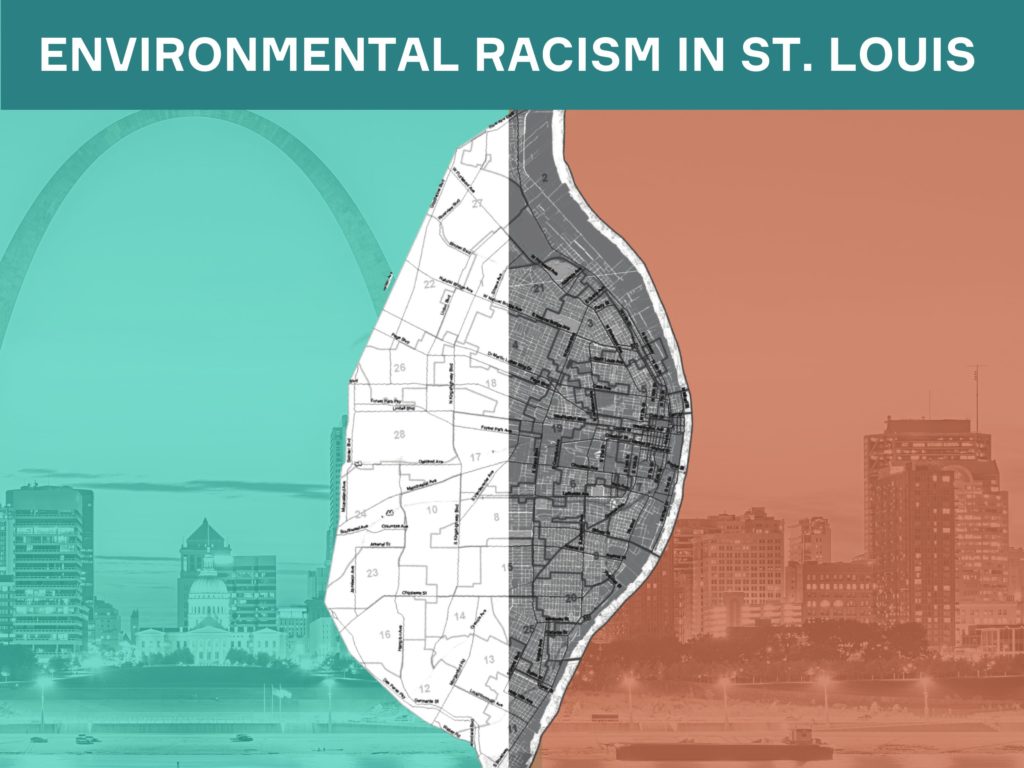
Developed in close collaboration with St. Louis community organisations, the tool was inspired by the 2018 report Environmental Racism in St. Louis. The Washington University’s School of Law report describes the heavy environmental burdens that are faced – and well-recognized – by Black residents in St. Louis, but rarely addressed.
TNC needed comprehensive and accurate flood hazard data to develop the tool. It was aware that the standard flood hazard dataset used in the US, produced by the Federal Emergency Management Agency (FEMA), underestimates flood risk (as shown by this study).
Notably, FEMA lacks data for the extensive system of flood walls and dams in St. Louis. These have been put in place because the nearby Mississippi and Missouri Rivers are highly likely to flood. But not all parts of the city have this protection. More detailed data were needed for TNC to better meet their goals of identifying the most vulnerable communities, driving resources to the frontlines and empowering community-led action.
TNC used the most comprehensive flood hazard dataset for the US, Fathom-US 2.0, to develop a fine-grained picture of risk in the St. Louis EcoUrban Assessment tool
This provided detailed and robust information on 100-year floods and 500-year floods – events that have a 1% chance and 0.2% chance, respectively, of occurring in any given year. The data covered both fluvial (river) and pluvial (rainfall) floods.
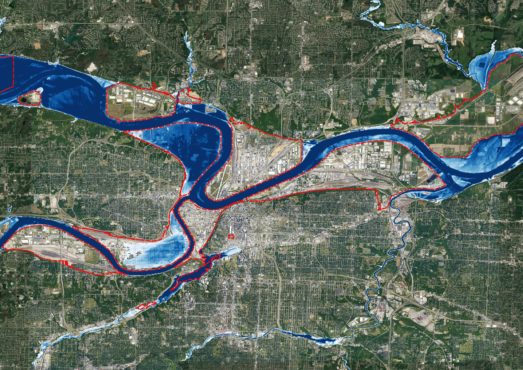
Fathom-US 2.0 is based on the latest science and includes the most complete flood defence dataset for the USA. Further, it includes total representation of fluvial and pluvial flooding, and simulates flooding for all sizes of river channel, from smallest to largest. This latter detail is significant in light of the recent flash floods in the St. Louis region that left an estimated 20,000 people without power and, in some instances, led to loss of life. The flooding occurred when smaller channels in inner-city areas became quickly overwhelmed by extreme rainfall. (Read Fathom’s assessment of these floods in 2022 here.)
Quote Fathom’s model goes beyond FEMA flood hazard models to account for missing levee, dam, and stormwater infrastructure. Their work has shown that current methods and FEMA models significantly underestimate flood risk, with Fathom estimating a threefold increase in total exposure to a 100-year flood.
Read Case StudyThe St. Louis EcoUrban Assessment tool went online in September 2021. Free- and easy-to-use, it makes the environmental challenges and inequalities in St. Louis far more visible
Users can toggle between different maps of St. Louis, and layer them on top of one another. Flooding layers that use Fathom data show 100-year and 500-year fluvial (river) and pluvial (rainfall) flood risk. These can be layered with a map of impervious surfaces, i.e., artificial surfaces, such as concrete or tarmac, that increase flood risk by preventing water soaking into the ground.
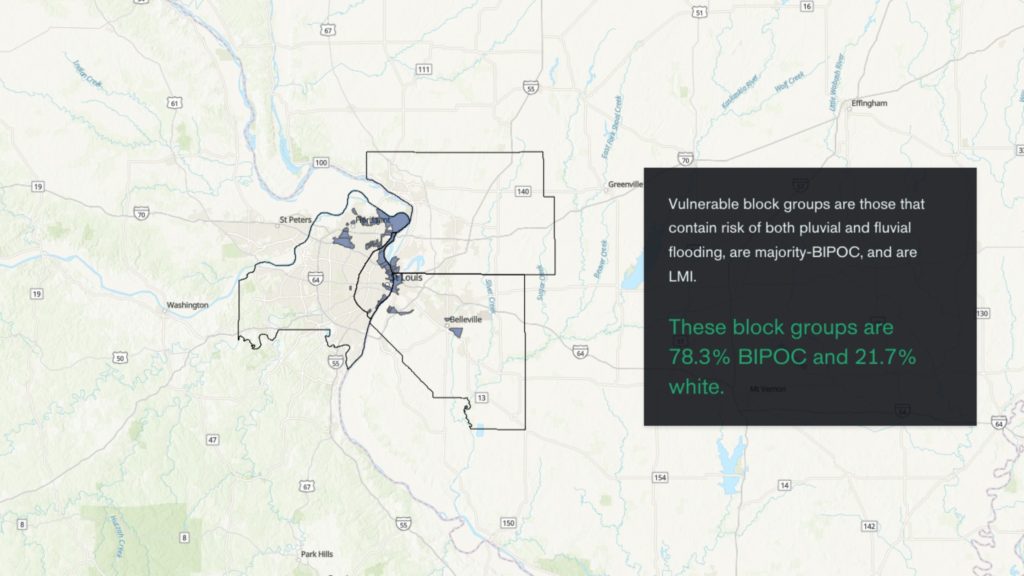
The tool shows that the most flood-vulnerable neighborhoods in the region may be those at risk of both fluvial and pluvial flooding. When flood and demographic data are combined, the tool shows that high-risk neighborhoods are low-to-moderate income (LMI) areas with a large majority (78.3%) of residents who are Black Indigenous and People of Color (BIPOC).

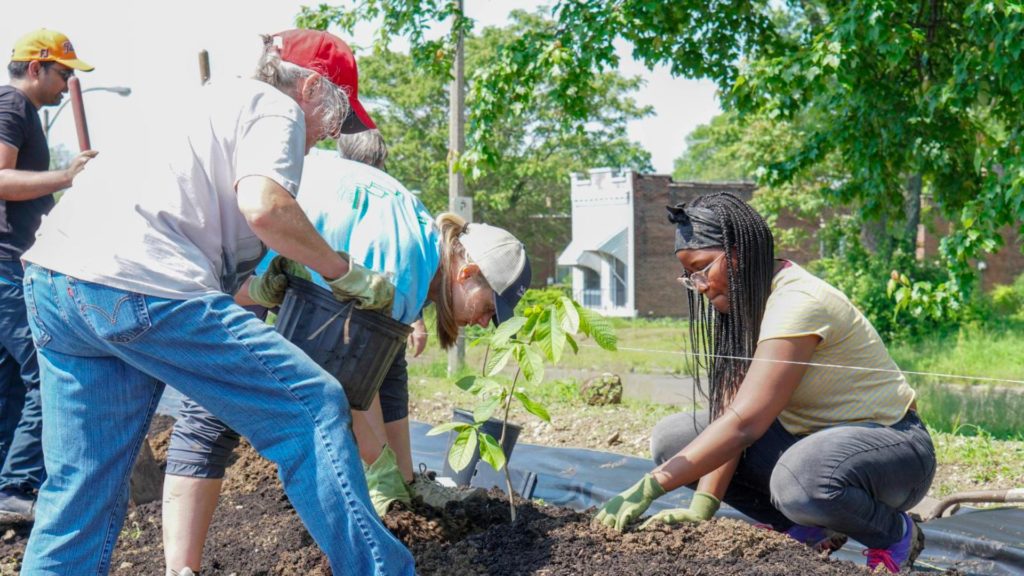
Covering both St. Louis County and City in Missouri and St. Clair and Madison counties in Illinois, the tool maps community assets, such as schools and places of worship, in relation to hotspots of environmental risks. These local partners are critical for creating collaborative community-driven solutions.
Quote We know that to address climate change challenges, like flooding, the solutions must be co-created in partnership with the communities that are most impacted. Fathom’s US flood hazard data allows us to better plan and prepare to address those challenges alongside the most impacted communities.
Validation of Fathom-US 2.0
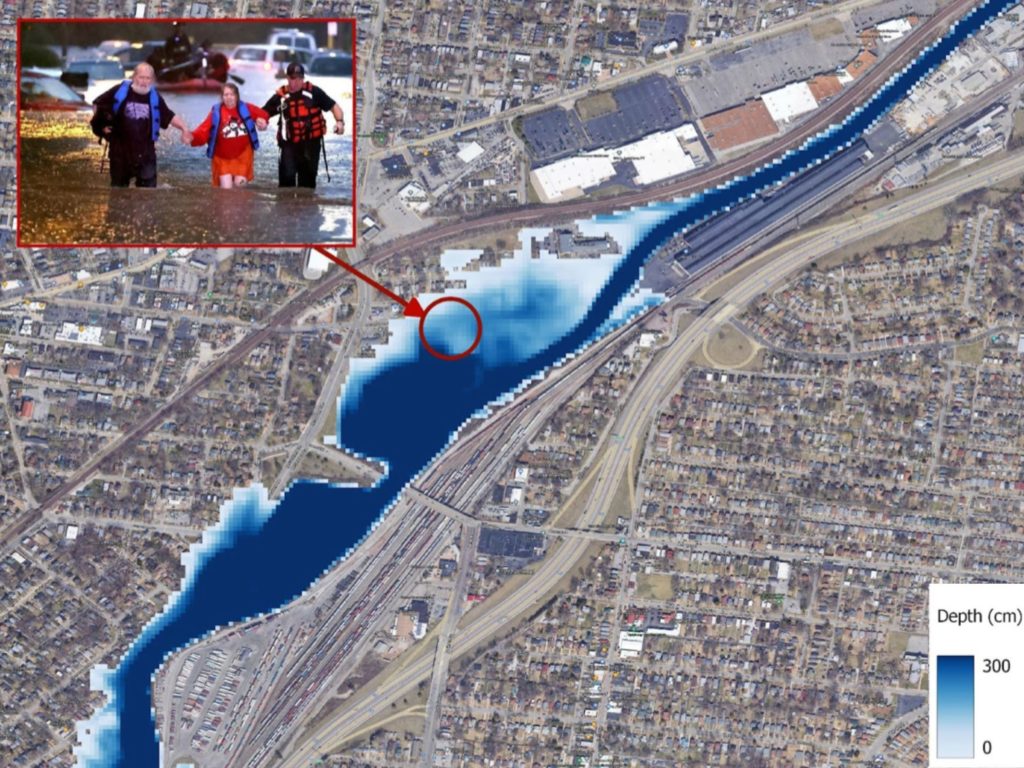
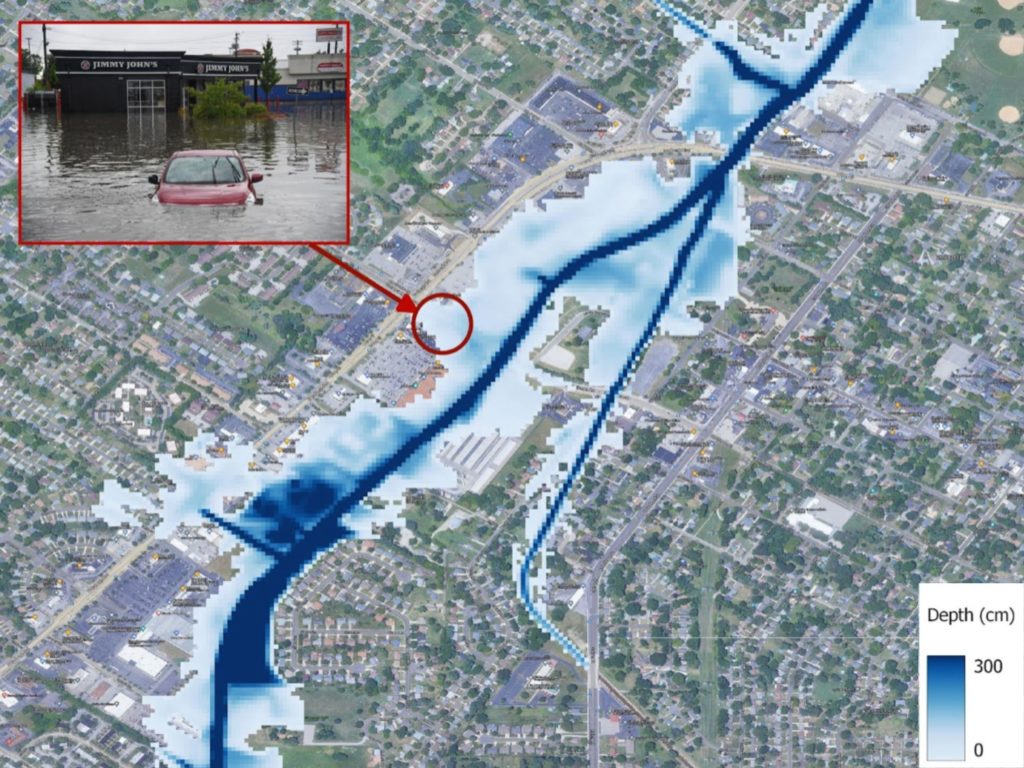
Record breaking flash floods happened across St. Louis in July 2022. The area of St. Louis is geographically interesting as it sits at the confluence of some of the largest rivers in the US. However, when extreme localized rainfall fell over a period of hours, the city experienced flash-flooding originating from small flow pathways, streams and rivers.
Following the event, Fathom’s technical team validated Fathom-US 2.0 to observe how well the model captured pluvial risk in impacted regions, using images shared by the New York Times. We found that the on-the-ground imagery correlated with our ~200-year hazard data. In other areas, our 1000-year hazard layer corresponded well, interestingly with a slight negative bias.
As we move into the future, we can expect extreme localized floods, like the one experienced in St. Louis, to happen more frequently. Urbanisation and global temperatures continue to increase and with this, it is critical that our flood models are able to effectively represent these changes and weather processes. Tools, like TNC’s St. Louis EcoUrban Assessment, are extremely important in taking complex flood hazard data and communicating high risk locations easily and at the local level.
Community organisations in St. Louis welcome the tool. Jenny Connelly-Bowen, Former Executive Director for Community Builders Network of Metro St. Louis, says:
“This new tool will help all of us better understand the unique challenges that each neighborhood in our region is facing and serves as a sobering reminder that communities of color remain on the front lines of the climate crisis”.
Related case studies

AXA: a cutting-edge catastrophe model for Europe
Learn how Fathom and AXA built a state-of-the-art catastrophe model that strengthens AXA’s financial resilience and regulatory reporting.
Arup & World Bank
Fathom & Arup demonstrate how rapid, data-driven flood modeling can quantify the impact of urban greening on flood extent, soil erosion, and urban heat. Discover how NBS can create more resilient cities.
Texas Water Development Board
Texas Water Development Board uses Fathom data, and others, to accelerate the development of the first statewide flood planning program in the absence of publicly available flood data.
FEMA’s Risk Rating 2.0
Fathom provided FEMA with a more accurate, up-to-date picture of US flood risk which informed how the NFIP prices insurance, using Fathom-US flood map.