
In this article, Dr Andrew Smith examines recent extreme flood events in St Louis using photography, model simulations and satellite imagery
Record-breaking flash-flooding hit St Louis this week causing extensive damage and unfortunately loss of life
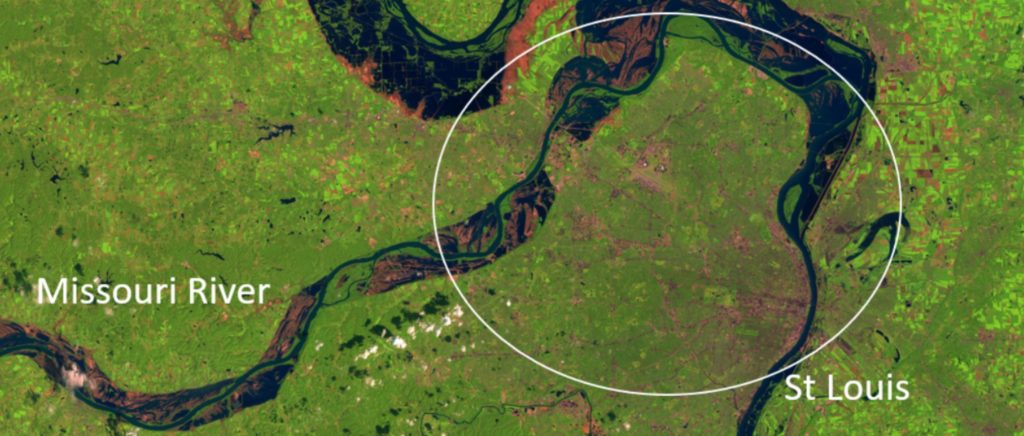
Geographically, St Louis sits at the confluence of some of the biggest rivers in America. The Mississippi, Illinois, and Missouri rivers all meet in the immediate vicinity of the city. These enormous rivers’ meeting unsurprisingly leads to extraordinarily large flood events. Indeed the 1993 event, known as ‘The Great Flood’ was easily visible from space, as seen in the image below.
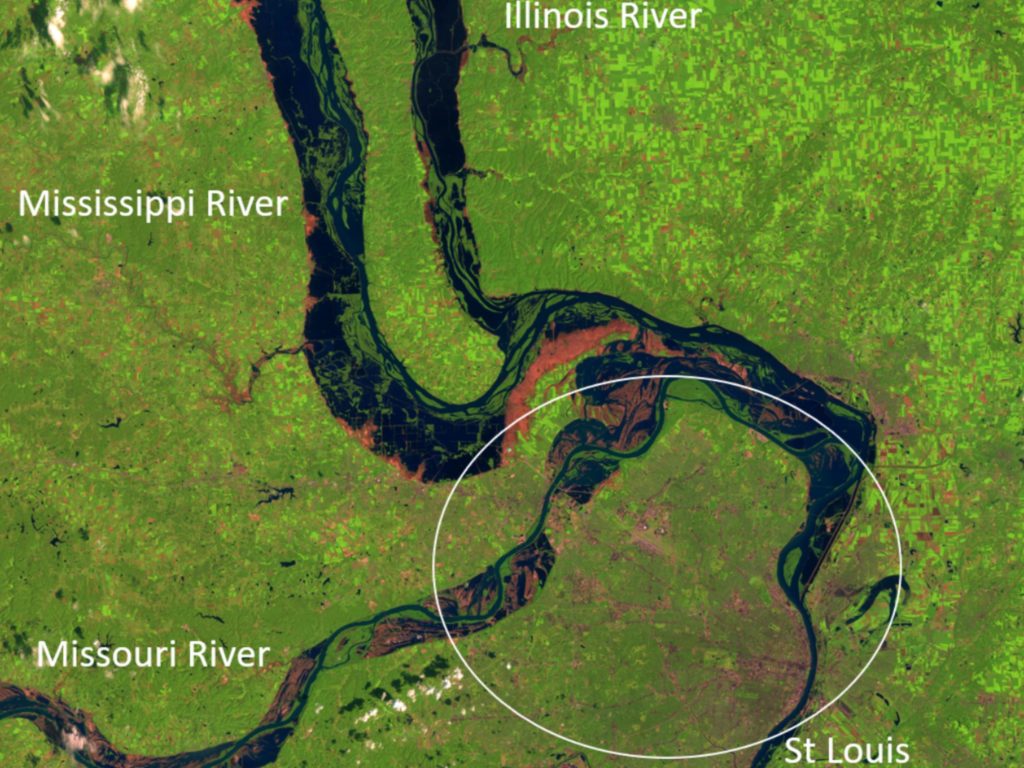
Although St Louis is encircled by huge floodplains, these floodplains are topographically well defined and have been extensively modelled. Therefore, they are well understood and relatively clearly identified as being hazardous areas. Moreover, flood events on rivers of this size are caused by enormous but very slow-moving flood waves. Indeed, the flood wave that generated the 1993 flooding propagated through the city over a period of not days but weeks. This provides at least the advantage of time in mitigating against some of the worst outcomes.
Flash-flooding within floodplains
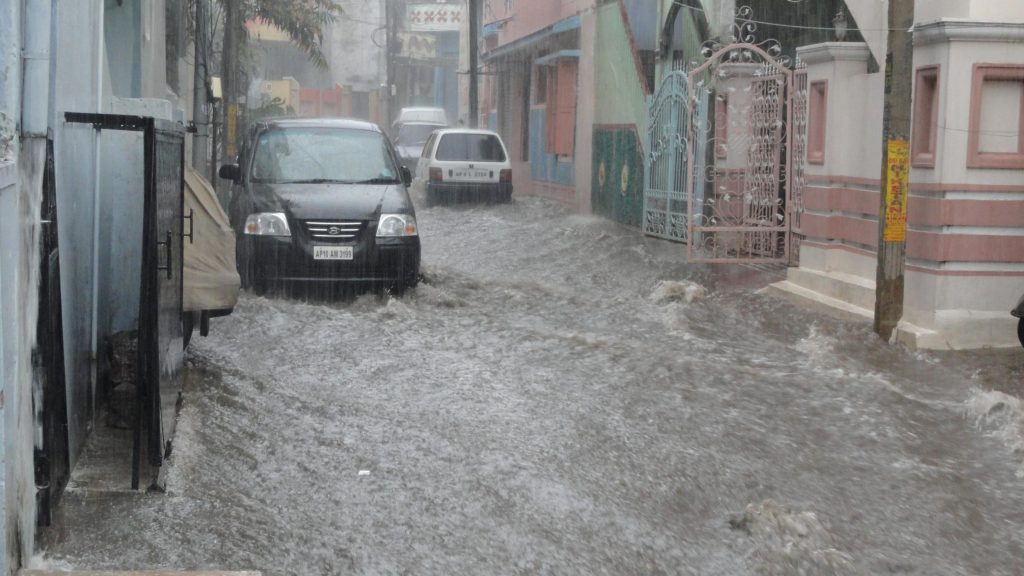
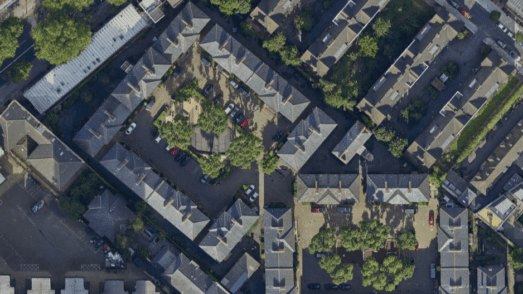
This week has seen a very different kind of natural hazard hit the city. Pluvial flooding or flash-flooding is caused by very extreme localised rainfall falling over a short period. This causes small flow pathways, streams and rivers to be quickly overwhelmed. These areas are sometimes deemed to be ‘off-floodplain’, as they aren’t seemingly within well defined floodplain areas, such as those that surround the city of St Louis. But these areas are indeed floodplains, they are just floodplains that operate on much smaller scales both spatially and temporally. A quick analysis of some of the river gauges on these small watercourses within the city reveals that the flood wave propagation occurred not over weeks but hours.
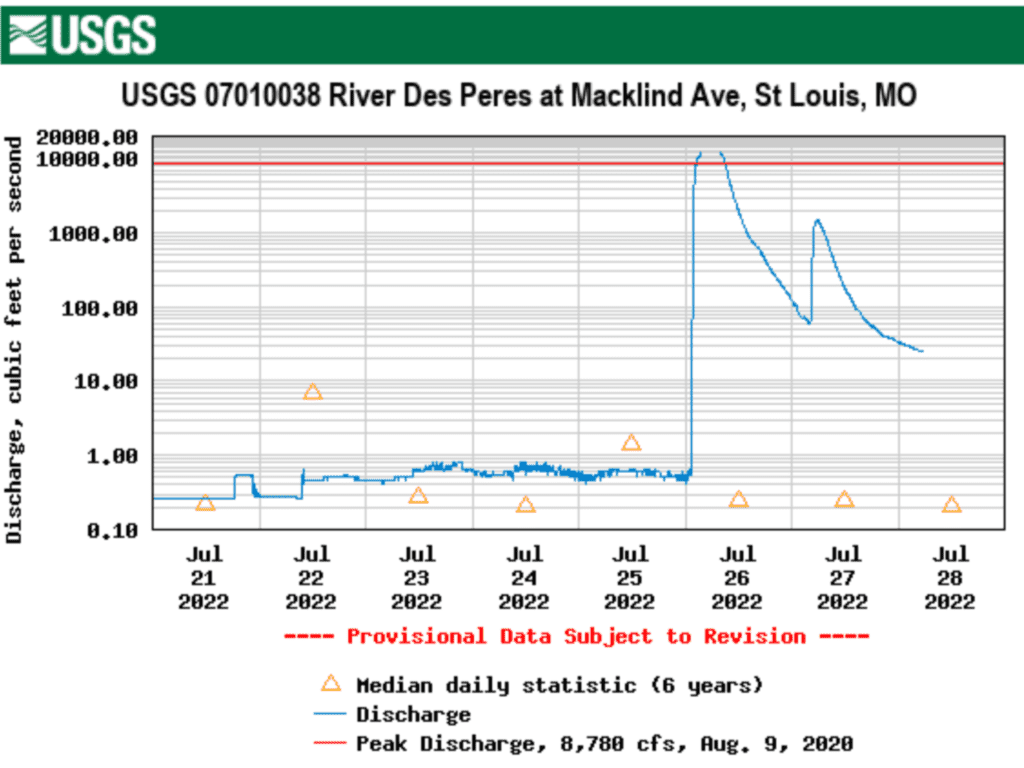
Smaller river channels, such as the one demonstrated by the gauge data above, are less obvious topographically and typically are more difficult to model. Therefore they are often ignored or overlooked. However, as we have seen this week, flood events on small flow pathways, particularly in inner city regions, can have a devastating impact. The flood waves that propagate through these systems do so over very short periods, often generating very fast-moving bodies of water. The speed at which they move, coupled with the fact that the most hazardous areas are often not well understood, can act to amplify the event severity.
Dr Andrew Smith discussed the extreme flood events in Kentucky and St Louis in an interview with CNN.
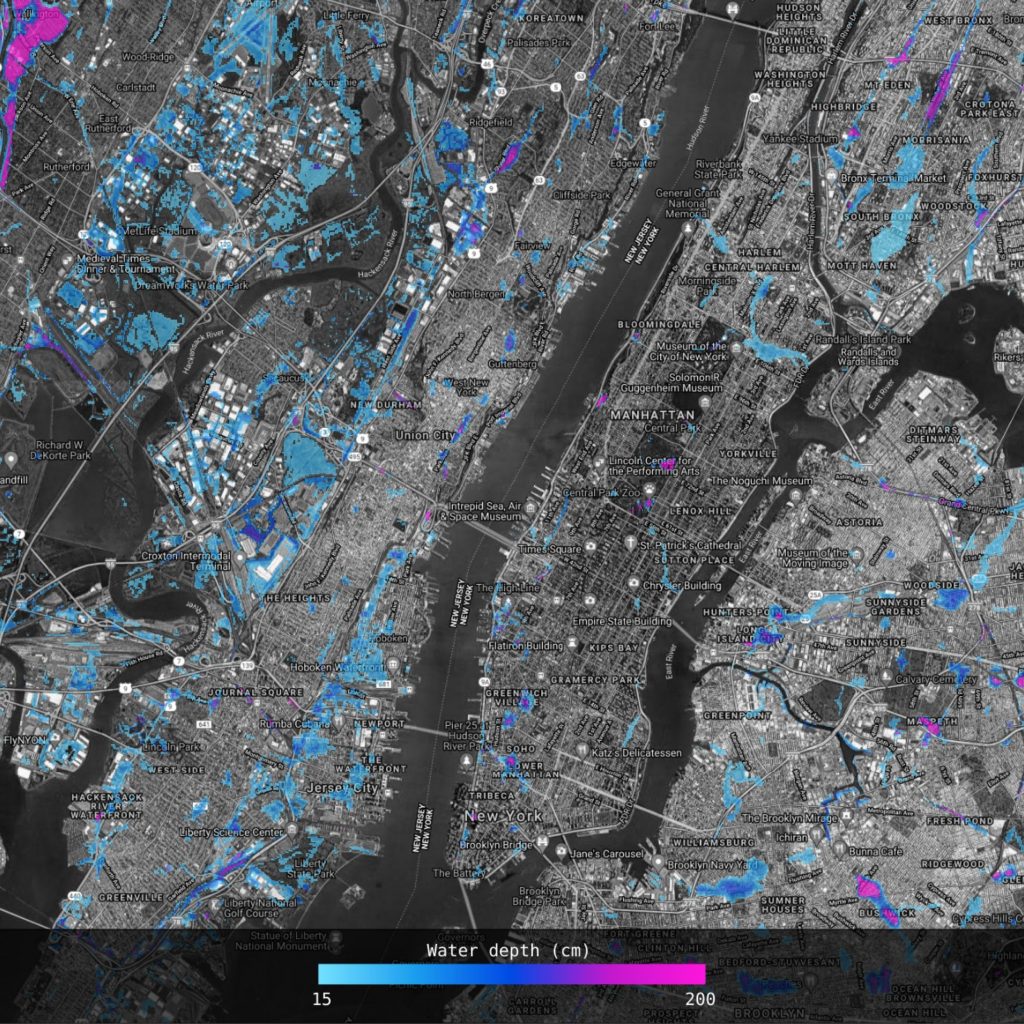
Fathom-US 2.0 flood hazard imagery
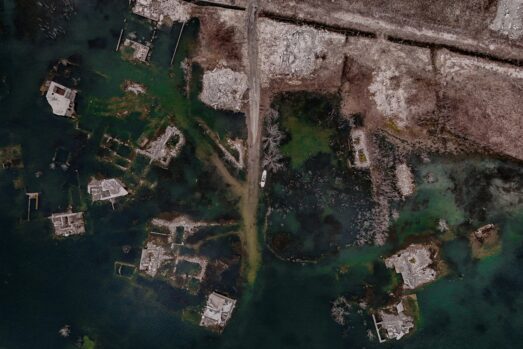
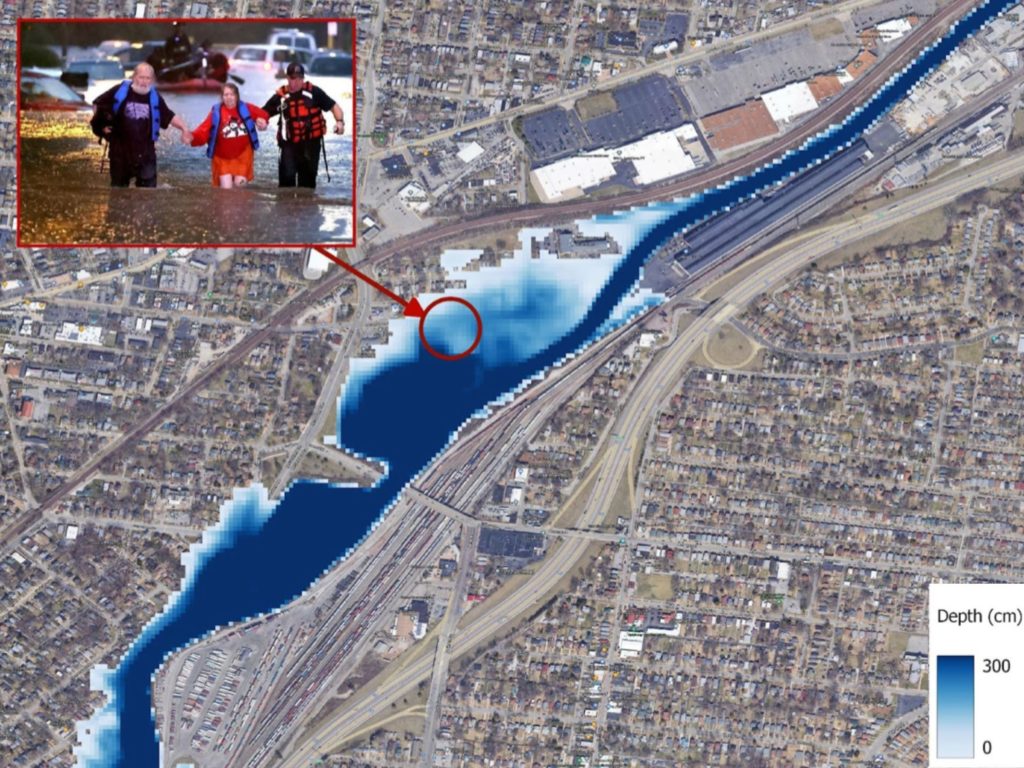
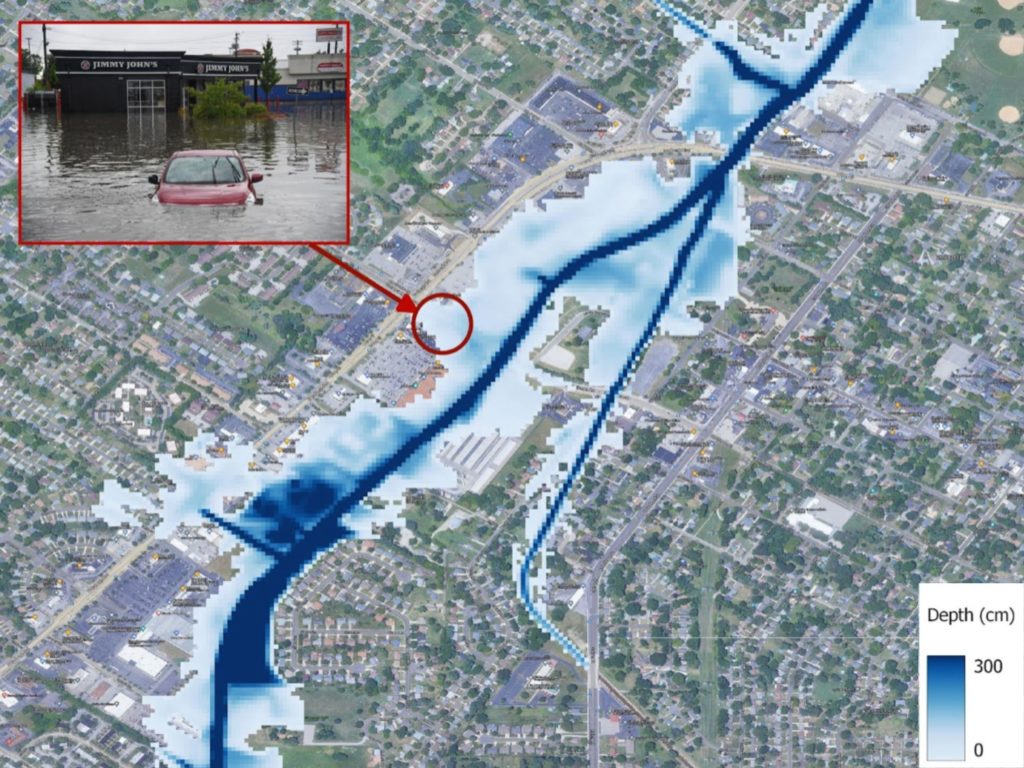
Some detective work using imagery in a New York Times article suggests that the Fathom- US 2.0 flood hazard data has captured the impacted areas relatively well. In some areas, our ~200 year hazard data seem to correlate well with on-the-ground imagery. In other areas, our 1000 year hazard layer corresponds well, interestingly with a slight negative bias. Once local gauges have been revised in the coming weeks, we can get a better understanding of the estimated probability or return period of the event. But at this stage, it is clear that the flooding that occurred this week constitutes a very extreme flash-flood event.
What can we expect for future flood hazard?
Looking to the future, there is a somewhat complex picture emerging with regards to the changes we can expect in terms of flood hazard on larger rivers in a warmer climate. The added intricacy of catchment hydrology and changes to larger-scale precipitation patterns yields a mixed picture in many areas. But at more local scales, we expect extreme rainfall to increase almost everywhere. The prospect of increased flash-flooding combined with increasing urbanisation will almost certainly lead to similar events as the St Louis flooding, increasing in both frequency and severity. It is therefore critically important that as risk modellers we strive to represent these processes in our models.
This kind of complex modelling challenge isn’t something that can be solved overnight. However, recent research advances such as the creation of our channel solver and extreme flow estimator, tell us that we are on the right track.