Equitable pricing of flood insurance in the US
Fathom provided FEMA with a more accurate, up-to-date picture of US flood risk which informed how the NFIP prices insurance
The problem
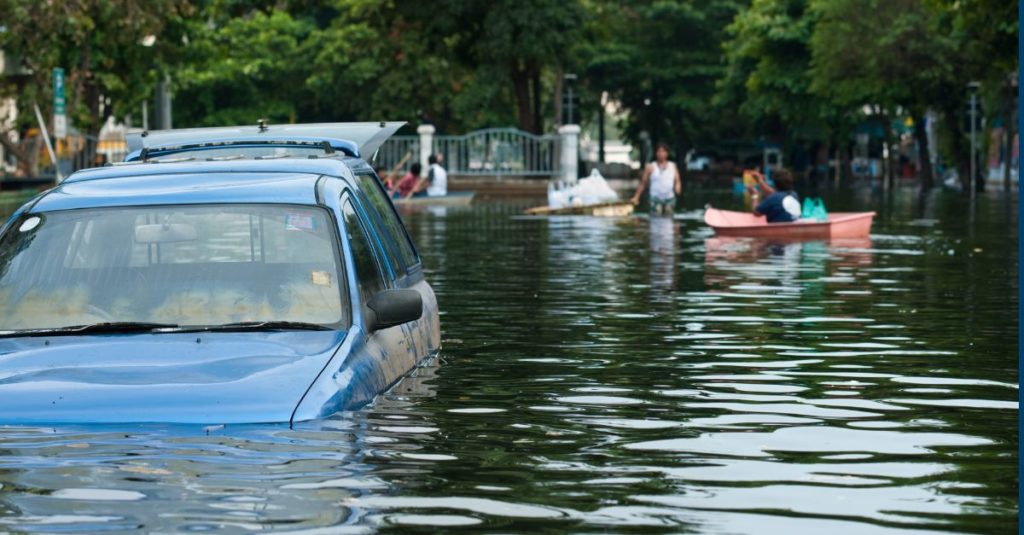
In 2021, the Federal Emergency Management Agency (FEMA) introduced Risk Rating 2.0, a new pricing methodology for the National Flood Insurance Program (NFIP), the largest single-line insurance program in the US.
Risk Rating 2.0 represents the biggest change in how the NFIP calculates flood insurance premiums since it began in 1968. FEMA had recognized that their previous pricing system was unfair; policyholders with lower-value homes often paid more than they should, while policyholders with higher-value homes underpaid. Further, FEMA understood that the old pricing method was not fiscally sustainable, given the increasingly severe and frequent floods brought by climate change in recent years.
To deliver insurance rates under Risk Rating 2.0 that are actuarily sound, more equitable, and which better reflect a property’s individual flood risk, FEMA needed a rich array of up-to-date, reliable datasets. Far more diverse than those used previously, these datasets covered multiple flood hazard sources and flood reduction measures.
Fundamental to developing Risk Rating 2.0 was a better understanding of how levees affect a property’s risk of flooding. These artificial embankments are designed to reduce overflow of rivers, but their effectiveness varies according to their design and location.
FEMA used overtopping frequency data (i.e., the likelihood that a flood event will exceed the height of a levee) to assess the effectiveness of levees.
However, their main source of these data, the U.S. Army Corps of Engineers’ (USACE) Levee Screening Tool (LST), accounted for only 19% of levee systems and 60% of buildings behind levees in the US. This left a data gap that would limit FEMA’s ability to price insurance products appropriately.
Project partners

Risk Rating 2.0 data sources for key levee data
Hazards
What are the hazards and how likely are they to occur?
Performance & condition
How will the levee perform in the face of these hazards?
Consequence
Who and what are in harm’s way? How susceptible to harm are they? How much harm is caused?
The solution
FEMA partnered with USACE to identify and use credible, consistently available information and methods to understand the effects of levees on flood risk
They supplemented LST overtopping frequency data with those from the National Levee Database (NLD). However, the NLD only provided data for fewer than 1% of US levees and just 4% of buildings behind levees.
Fathom-US 2.0 played a key role in filling the remaining data gap. This flood hazard dataset is the most comprehensive for the US. Based on the latest science, it includes the most complete flood defence dataset built with input from multiple agencies.
FEMA used Fathom-US 2.0 data to calculate overtopping frequency estimates for a further 17% of levee systems. The result is that 37% of levee systems considered in Risk Rating 2.0 have an overtopping estimate derived directly from either the LST, NLD, or Fathom-US 2.0, covering 75% of the buildings behind levees.
No other data sources were used, and assumptions had to be made for the remaining levee systems. Fathom-US 2.0 was, again, used here and informed estimates for a further 6% of all remaining levee systems, which accounted for another 15% of leveed buildings.
For these systems, FEMA assumed overtopping frequency to be a 1% annual exceedance probability (AEP) (100-year flood) for levee systems accredited on a Flood Insurance Rate Map (FIRM), including where Fathom data estimated more frequent overtopping. Where Fathom estimated levee overtopping to be less frequent than the 1% AEP for an accredited levee, the overtopping frequency derived from Fathom was used.
FEMA conducted a series of quality checks and then validation on Fathom-US 2.0 to give confidence that it could reasonably predict overtopping frequency where LST or NLD data were absent. The validation compared levee systems where both Fathom and NLD or LST data were available, with no significant data bias identified.
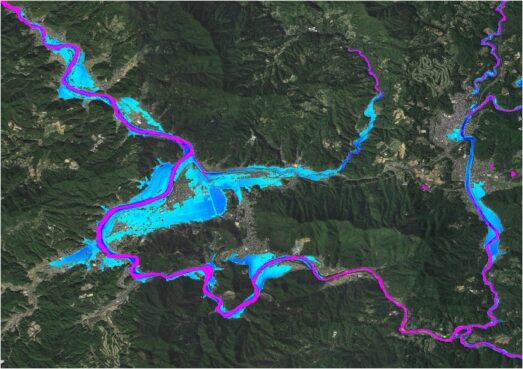
Discover the latest in US flood data, Fathom’s Global Flood Map
The most complete and technologically advanced flood map of the United States to date.

The results
FEMA fed the levee data into catastrophe models that calculate average annualized loss at the building level
From this, they could set the new insurance rates by equitably distributing premiums across all policyholders based on the value of their home and the unique flood risk of their property.
This pricing system has been in use since October 2021. It represents a new understanding of flood risk that moves away from a binary depiction of flood risk, centered around the 1%-annual-chance flood event. Instead, it takes a graduated approach that accounts for a wide range of flood hazard probabilities. The levee data were critical to this graduated approach.
FEMA believes that the new risk rating system is easier for policyholders to understand and trust, and will make it easier for agents to sell products and close the insurance gap. In turn, it will support wider economic activity by enabling households and businesses to rebound more quickly following flood damage.
Learn more about Fathom-US 2.0
Related Case Studies

AXA: a cutting-edge catastrophe model for Europe
Learn how Fathom and AXA built a state-of-the-art catastrophe model that strengthens AXA’s financial resilience and regulatory reporting.
Arup & World Bank
Fathom & Arup demonstrate how rapid, data-driven flood modeling can quantify the impact of urban greening on flood extent, soil erosion, and urban heat. Discover how NBS can create more resilient cities.
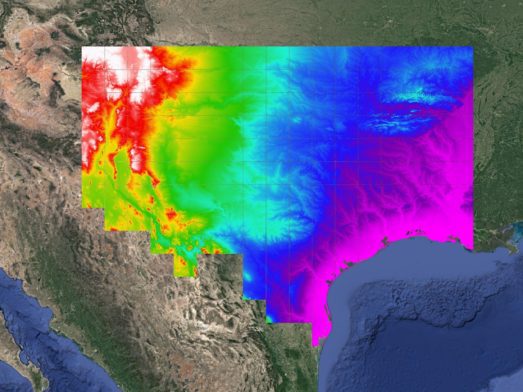
Texas Water Development Board
Texas Water Development Board uses Fathom data, and others, to accelerate the development of the first statewide flood planning program in the absence of publicly available flood data.
Floodbase
Learn how Fathom’s high-resolution Global Flood Map enabled Floodbase to develop a comprehensive view of catastrophic flood risk in Tajikistan & Zimbabwe.