UK Flood Map
A UK Flood Map that offers comprehensive climate-conditioned flood hazard modeling for the whole of the United Kingdom
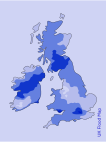

Fathom’s UK Flood Map offers an alternative view of flood risk against existing government data. Covering flash, riverine and coastal flooding, it projects changes in hazard across multiple different climate scenarios. This provides businesses with actionable insights into UK flood risk both now and into the future.
Based on Fathom’s award-winning global flood map, the UK Flood Map combines world-leading research and cutting-edge modeling techniques with high-quality terrain data. Fathom’s UK Flood Map enables you to critically assess the impact of UK flood risk against any portfolio, book of business or asset.
Use cases for UK flood risk map
Fathom’s UK Flood Map is used by a diverse range of sectors to translate physical hazard into actionable business intelligence.
Insurance underwriting and pricing
Major UK insurers and the Lloyd’s market use our data for:
address-level risk selection
setting actuarially sound premiums
managing accumulation risk across portfolios
Engineering and infrastructure
Civil engineers use the map for initial site screening and feasibility studies. It has been utilized for large-scale resilience assessments of critical linear assets, such as the UK’s 20,000-mile rail network, to identify vulnerable hotspots before ground-based surveys begin.
Mortgage and banking risk
Financial institutions use Fathom’s Risk Scores to screen loan books and mortgage portfolios. The data supports mandatory regulatory reporting and climate stress tests, helping banks identify “stranded assets” and quantify potential Loss Given Default (LGD) under different warming scenarios.
Real estate due diligence
REITs and property developers use our future-facing maps to conduct climate-aware due diligence, ensuring new developments are resilient to both current hazards and projected 2050 flood levels.
Public sector planning
Local authorities and government agencies use our data for sub-national risk assessments and emergency planning, particularly in regions where existing national mapping may be outdated or incomplete.
Flood plain maps
Fathom has worked extensively with floodplain management associations. Fathom’s high-resolution UK flood map offers data-driven insights, enhancing existing government data to guide critical decisions around floodplain management and risk mitigation.
Fathom’s UK Flood Map shows flood depth and extent for multiple return periods and climate scenarios, giving floodplain managers a consistent, comprehensive view of both present and future flood risk to assets and infrastructure.
Future flood map UK
Fathom’s UK Flood Map provides projections for present-day flood risk (2020) and any projected combination of future year and climate scenario up to 2100.
Fathom’s UK flood map uses our Climate Dynamics framework to allow you to fully customize your view of risk under different climate scenarios and warming levels using IPCC pathways (SSPs, RCPs) or NGFS frameworks.
UK flood map 2050
Fathom’s UK Flood Map shows that in 2050, which is when the UK aims to meet net-zero emissions targets, flood risk to homes in the UK is likely to be significantly higher than at present. Bates et. al found, if all countries’ COP26 and net zero emission reduction pledges are not met in full, that the annual cost of flooding in the UK over the next century could grow by between 13% and 23% above recent historic levels, depending on different levels of climate extreme projections.
UK data powered by Global Flood Map
Fathom’s UK Flood Map is a subset of Fathom’s award-winning Global Flood Map – the first global flood map to provide risk professionals with all flood perils and climate options.
Key features of Fathom’s UK Flood Map:
Key features of UK Flood Map
~30 meter resolution
1 arcsecond data, based on FABDEM+, our complete map of the Earth’s terrain.
Understand future risk
Understand future risk with climate-conditioned hazard data for any projected combination of climate scenario and future up to the year 2100.
Inland and coastal flooding
Assess risk from all major types of flood – fluvial, pluvial and coastal, with both defended and undefended views.
High-quality terrain data
Combining Fathom’s global terrain dataset, FABDEM, with high-quality local LiDAR enabling calculation of water surface elevation
Metadata for additional transparency
Fathom’s assessment of data certainty for any given location. Empowering you to understand how influencing factors in input data may impact the certainty of flood risk.
Available as depths and Risk Scores
Our flood maps are available as flood depths or Risk Scores. Risk Scores: as Relative Risk or Risk Category are designed to deliver an efficient and consistent way to assess and compare risks.




How to access Fathom’s UK Flood Map
Fathom API

Self serving, seamless data provision using Fathom’s cloud-based API. By using the API, Fathom’s users get on-demand access to the entire UK Flood Map.
Fathom Portal

If you do not have an in-house platform solution, Fathom’s portal offers an interactive platform by which users can host, view and analyse data. If you are interested in this solution, you can trial the platform using Fathom sample data for free. Request a trial here.
Direct Provision

If you would prefer to host the data on-site, Fathom can provide you with GeoTIFF files that can be integrated within your internal systems and data viewers.
Partner

Whether you are in need of advanced consulting, geocoding or already have an existing platform that you are working with, Fathom’s data can seamlessly integrate with a wide range of platforms for your analysis. Get in touch to enquire about a platform or learn more about our existing partners here.
Relevant research
A climate conditioned catastrophe risk model for UK flooding

Assessing flooding impact to riverine bridges: an integrated analysis

A simple inertial formulation of the shallow water equations for efficient two dimensional flood inundation modelling
Distributed whole city water level measurements from the Carlisle 2005 urban flood event and comparison with hydraulic model simulations
Evaluating the effect of scale in flood inundation modelling in urban environments

Reach scale floodplain inundation dynamics observed using airborne Synthetic Aperture Radar imagery: data analysis and modelling
