Overcoming the challenges floodplain managers, water professionals and engineers face in mapping flood hazards.
A lack of adequate and complete flood inundation data is a major barrier to flood analysis and water risk identification across the United States.
Although FEMA is an excellent resource, its mapping is a patchwork of small scale ‘traditional’ flood models that only cover 60% of the U.S. In this webinar, experts in U.S. engineering and floodplain mapping discussed how they are working together to fill in the missing gaps.
The webinar, recorded on May 5th 2022, covers FEMA flood data, the availability of scientific flood data from alternative sources, a case study on how Texas developed the first statewide flood planning program using Fathom data, and an extensive audience Q&A which is transcribed below.
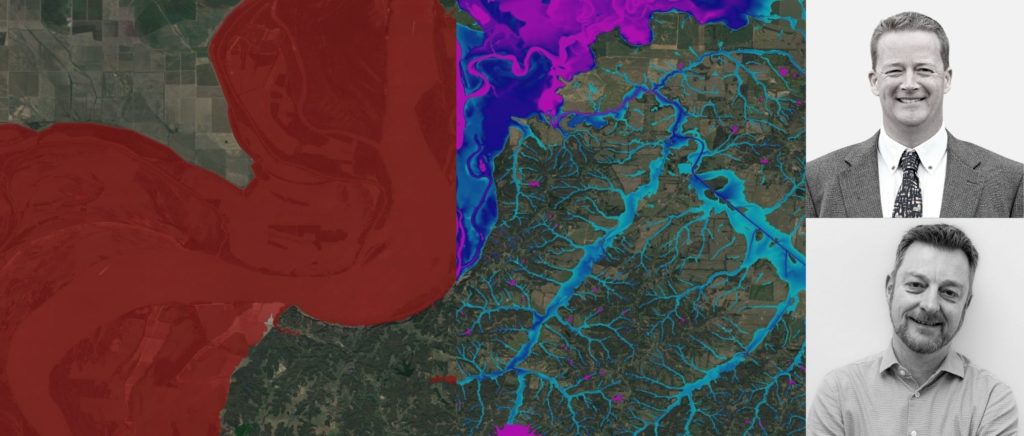
Panelists:
Gavin Lewis, Head of Engineering, Fathom
Dr Barney Austin, President and CEO, Aqua Strategies
Full audience Q&A from live webinar May 5th 2022
Less than 1% of the cost of developing the BLEs.
It was for the whole of Texas.
All counties in Texas were mapped.
In the US we use Intensity-duration-frequency (IDF) data taken directly from NOAA.
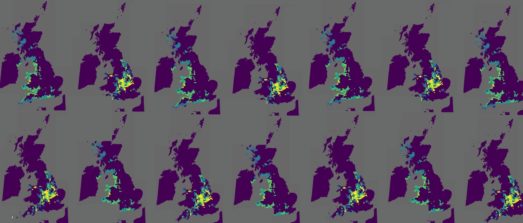
Good question. The best context with which to think of these models is that they provide a skillful screening tool to identify potentially risky areas. They can be used, for example, to provide guidance on where to undertake further detailed local modeling. Moreover, they also provide a tool with which to conduct comprehensive, large scale risk analysis. Although this is a large scale automated modelling framework, that will undoubtedly contain errors particularly at the individual building scale, at large scales we anticipate that these errors cancel out. In other words, there appears to be little bias in the models. So they are a useful risk analysis tool. Lastly, these frameworks can be re-run very easily. There, conducting ensemble simulations or re-running in light of new data is straightforward. This becomes particularly relevant with regards to climate change simulations and evolving climate impact studies.
Three modules ran independently.
At Fathom we largely use new FEMA data to validate and indeed calibrate/improve our modelling frameworks.
No. Same dataset.
One of the more sensitive parameters is the assumptions behind the channel conveyance. We can’t observe the size of channels everywhere, therefore we link the size of the channel to an estimated flow exceedance probability (e.g. the 1in2 year event). The exceedance probability estimated here has a significant influence on model behaviour.
Both. We use recorded estimates of defense and also a levee detection algorithm that estimates the presence of levees from LiDAR data. No plans to provide uncertainty data on levees at this point.
Perhaps best to refer to the initial paper detailing this: https://www.sciencedirect.com/science/article/abs/pii/S0022169410001538
There are many areas of improvement including; channel parameterization, missing defense data, improved hydrography (in some areas), better representation of human factors/control. We also know that the model performance tends to decrease in some climates: https://agupubs.onlinelibrary.wiley.com/doi/full/10.1002/2017WR020917
This is not the case. Fathom does not work with FEMA directly.
Yes, for sure!
Only to the extent these have been “seen” by the historical tide gauge data.
To the extent King Tides have been observed in the historical tide dataset, they will be considered in the statistics for the coastal inundation module. We can also run various tide and storm surge scenarios fairly easily.
Yes, for sure!
Partly because we look further up the tributaries, partly because many areas aren’t mapped by FEMA. In the areas that do have FEMA maps, sometimes they are out-of-date due to urbanization.
It depends on what you mean by mesh delineation? The data are delivered in their raw, gridded format.
The model tends to perform better in certain climatologies. Arid regions for example are difficult to model. Version 1 of our model was used to explore this: https://agupubs.onlinelibrary.wiley.com/doi/full/10.1002/2017WR020917
Hard to determine which of the two models is better!
We explored this at length in a recent study. Interestingly, and surprisingly to the research team, an extensive probabilistic modeling exercise explicitly simulating compound events revealed that co-currence had only a small impact on severity. https://agupubs.onlinelibrary.wiley.com/doi/full/10.1029/2020WR028673
Not currently. However, we do make our data available for free for academic purposes.