The Fathom team will be presenting their research on global flood modelling and flood risk at #EGU22 in Vienna, Austria this week. As part of this conference, Chief Research Officer Dr Oliver Wing presents research on UK flood risk in a changing climate.
Video Transcript
0:01 Hello everyone. My name is Ollie Wing and I’m the Chief Research Officer at Fathom. This is a presentation I’ll be giving at EGU in Vienna this month where I’ll try and squeeze a whole bunch of flood risk science into a very short space of time with this presentation on a climate conditioned catastrophe model for UK flooding.
0:17 Thanks to my Fathom co-authors James Savage, who led this modelling work alongside Paul Bates and Andy Smith. So here’s how it all comes together.
0:27 With the time constraints of this talk. I only have five minutes. I can either speak at you like a machine gun or simply leave bits out.
0:35 These areas highlighted in bold are pretty standard parts of our flood models. And we’ve presented on this many times where the U.S. or global focus while probably the most important bits of the methods.
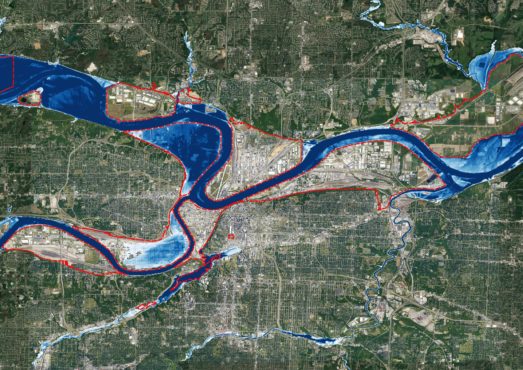
0:45 I’ll put these to one side. These components form the fluvial, pluvial, and coastal flood hazard maps of the UK simulated at 30 meter resolution and downscaled to 10 meters with each simulation described by an exceedance probability or return period. I’ll also gloss over the climate change elements of this model, how we update the hazard maps to provide a view of future flood hazard.
1:09 For inland flooding, this involves the derivation of change factors based on the 12 kilometer regional climate model from the UK Met Office.
1:17 These change factors are then applied to the historical boundary conditions of our model. And we re-simulate, for the coastal case, we simply uplift for sea level rise.
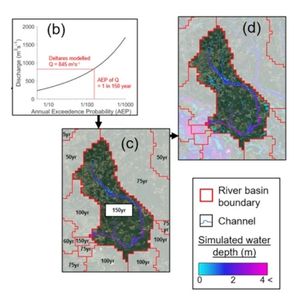
1:27 I will talk to you a little about the event set. This involves stochastically generating plausible event footprints in space, extending the constant return period in space assumption that the hazard maps represent.
1:41 When we have an understanding of the correlation between locations, you can now produce a loss of exceedance curve. The final piece of the puzzle is the exposure data asset locations, and their characteristics and the vulnerability functions, which describe their susceptibility to damage conditional on hazard.
2:02 And then finally, we get to the outputs, which is what I’ll focus on now. So here is our national loss exceedance curve under different climates on the X axis is the probability of loss being exceeded in a given year.
2:15 And the Y axis reflects that loss. Our historical model is the dotted line under which there was already 0.6 degrees Celsius of warming since preindustrial. Today at around 1.1 degrees Celsius we can see a very slight shift in that curve. Average annual losses have increased by £10 million with a hundred year flood occurring, 13% more frequently.
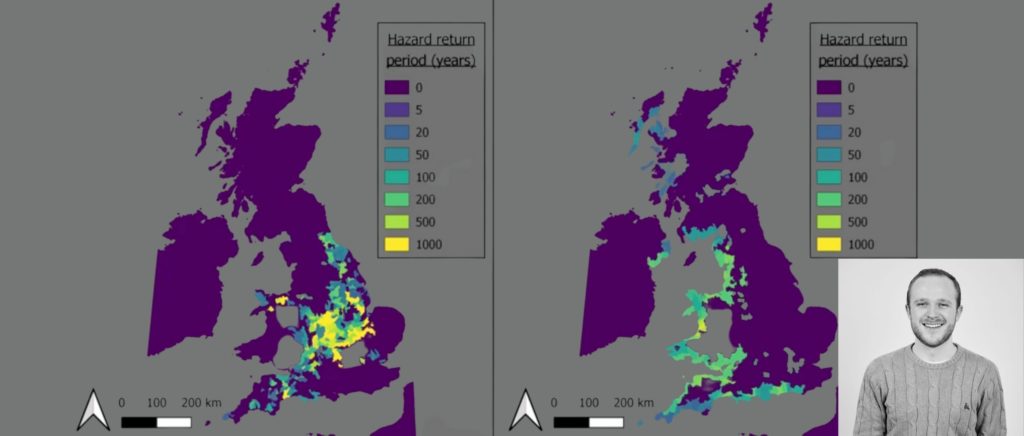
2:39 In for example, a two and a half degree world, represented by the dashed orange line our average annual losses go up by 11% and the hundred-year flood of today would happen on average every 68 years. I haven’t had time to show you the whole treasure trove of hazard model validation that we’ve done, but if we cast an eye towards risk model validation, we can see the following.
3:05 The leftmost dash line is the average annual loss based on 20 years of insurance data. From our 10,000 years of losses, I have randomly sampled 20 year chunks of data, 10,000 times to yield the distribution shown here.
3:20 This shows you that yes, we do match observe losses very closely, but 20 years of data is a very short record.
3:28 So the historical losses may have just been lucky or unlucky. They’re just one realisation of the possible risk. The 95% confidence range based on sampling error is over a hundred percent at the average value.
3:41 So that shows you how dangerous over calibration to history can be. What we’ve also shown is the results from official government reports, we’ve got the national flood risk assessment and the climate change risk assessment.
3:55 These results are not within that sampling error envelope. In fact, they sit six to seven standard deviations outside of it, losses that these reports say will be exceeded every year.
4:07 On average, our model suggest would be exceeded every 15 years. This adds to the evidence case that these exercises using simplified models do produce heavily biased results.
4:21 And that’s it. There are some more details on the screen. So please visit the relevant pages of the Fathom website, or just drop me an email if you have any questions. Thanks a lot.
What is EGU?
EGU is the European Geosciences Union, a non-profit organisation which is headquartered in Munich and was founded in 2002.
As the leading organisation for earth, planetary, and space research in Europe, EGU has over 18,000 members from 135 countries.
Each year EGU holds a General Assembly which is a yearly conference for geoscientists to share work and ideas with experts on an international scale.
EGU 2022
This year, EGU22 will be held in Vienna, Austria between 23rd – 27th May 2022 in a hybrid format. The conference will include a series of five minute long presentations from academics who have joined from all over the world.
Several members of the Fathom team will be presenting their research including Prof. Paul Bates, Dr Oliver Wing, Dr Andrew Smith, Gaia Olcese, and Dr Jeffrey Neal.