

Modeling US transportation network flood risks
The National Capital Region Transportation Planning Board (TPB) used Fathom’s data, analyzed and applied by ICF, to assess flood risk across the region’s transportation system. The analysis revealed that significantly more assets were at risk than previously thought.
An analysis of how flood impacts a transport system
The Metropolitan Washington area, comprised the District of Columbia, suburban Maryland, and Northern Virginia, is vulnerable to three types of flooding, fluvial (riverine), pluvial (flash) and coastal.
Flooding can seriously impact transportation infrastructure and Fathom’s US Flood Risk Index reveals that the District of Columbia is among the five states with the highest flood risk to road networks and has the highest percentage of rail network at risk of flooding.
TPB, which is staffed by the Metropolitan Washington Council of Governments (COG), is the federally designated metropolitan planning organization (MPO) for the metropolitan Washington region. To receive federal funding, transportation projects in the region must be included in the TPB’s metropolitan transportation plan and transportation improvement program (TIP). TPB is also responsible for coordinating regional transportation planning.
With flood risk in the area expected to increase because of development, urbanization, rising sea levels and increasingly severe weather events, TPB recognized the need for a deeper understanding of how flooding can impact the region’s transit systems.
Lack of high-resolution flood data leading to underestimation of risk
In 2024, TPB carried out a risk-based climate vulnerability assessment to help identify priorities for investment and build resilience and preparedness in the region.
This included analyzing flood risk to transportation assets, including bridges, bus stops, rail stops, rail lines, and roads using the Federal Emergency Management Agency’s (FEMA) 100-year, 500-year and buffer flood data.
While this assessment helped highlight assets that were highly vulnerable to flooding, it also revealed major gaps.
The FEMA datasets were not forward-looking, and they did not explicitly capture pluvial flooding. This meant that some of the assets potentially at risk of flooding (and some that had already experienced flooding) were missing from the FEMA-mapped floodplains, and flood risk was potentially being underestimated.

Flood data for infrastructure resilience
TPB worked with the global consulting and technology services provider ICF* to source additional inland flood data to complement FEMA datasets in an updated flood risk assessment.
This analysis helps TPB better understand inland flooding and inform long‑term investment decisions across the Metropolitan Washington Area.
Analyzing Fathom’s US Flood Map
Fathom’s US Flood Map uses high‑resolution elevation data and explicitly includes both pluvial and fluvial flooding. It also projects future flood extents under various future climate conditions and multiple return periods.
First, ICF undertook a comprehensive, independent technical analysis and validation process on Fathom’s dataset and other competitive datasets before integrating it into an updated flood analysis.
The exercise was a multi-step technical evaluation involving a formal scoring system, comparison with alternative datasets and integration with established FEMA flood data.
* As a result of this project, ICF has since become an official partner of Fathom
1. Procurement-stage technical validation
ICF assessed the datasets’ performance in terms of spatial resolution, flood process representation (fluvial and pluvial), geographic coverage and climate scenario capability.
2. Structured technical scoring
ICF developed a scoring framework to evaluate and compare candidate flood hazard datasets using the same technical criteria, including horizontal grid resolution, quality and source of terrain inputs, geographic coverage and availability of forward-looking climate scenarios.
3. Benchmarking against FEMA data
ICF overlaid hazard maps from Fathom and other providers with mapped floodplains from FEMA to create a unified regional exposure dataset. This side-by-side assessment showed that Fathom’s modeled flood extents captured additional at-risk areas beyond FEMA maps.
4. Expert methodological review
Finally, ICF performed a technical review of the flood models’ underlying assumptions, analytical framework and computational structure. This helped to verify the methodological soundness, transparency and overall suitability for regional-scale resilience and planning decisions.
After this thorough independent review of a range of data providers, ICF concluded that Fathom’s flood hazard data met the project’s technical requirements and recommended it for use in the updated regional transportation risk analysis for inland flooding.
“Traditional models often failed to capture the full spectrum of flood hazards, particularly the evolving threat from both riverine (fluvial) and surface water (pluvial) flooding driven by climate change.
Fathom’s data provides a comprehensive, high-resolution view of these future risks. ICF validated and integrated Fathom’s advanced, peer-reviewed flood models to provide critical, data-driven insights into precisely how future fluvial and pluvial flooding could reshape risk profiles across Washington D.C., and parts of Maryland and Virginia.
This superior level of analysis has empowered TPB to make smarter, more forward-looking planning and resilience investments.”
Daniel Bishop, Climate Scientist at ICF

An updated flood exposure analysis
Having validated Fathom’s data, ICF integrated it into TPB’s updated flood risk analysis, using its newly developed flood exposure scoring approach.
TPB analyzed flood risk for roads and highways, bus stops, rail stops, and rail lines under historical and future conditions (2030, 2050 and 2080) across moderate and high emissions scenarios, as agreed with stakeholders. Flood depth and extent were evaluated for 100- and 500-year events using Fathom’s “known defended” scenario, which incorporates existing levees and dams.
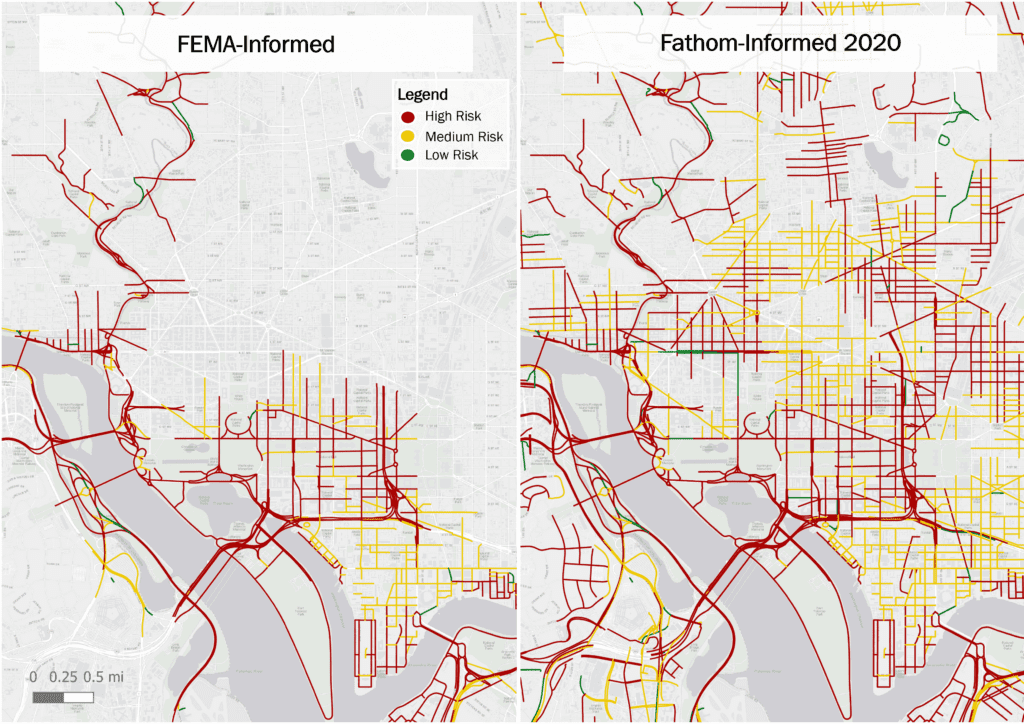
The analysis compared FEMA‑informed and Fathom‑informed risk scores to highlight differences in exposure and vulnerability. Ultimately, the results based on the Fathom-informed inland flooding analysis were intended to complement and not replace the FEMA-informed analysis by providing an additional, forward-looking understanding of inland flooding.
Under-represented inland flooding risk revealed
The Fathom-informed analysis revealed that significantly larger portions of critical transportation infrastructure are at risk of flooding compared with the FEMA‑informed assessment.
For example, the Fathom-informed analysis identified that 64% of rail line miles are exposed to flooding using the 2020 (historical) scenario, compared with the 39% identified in the FEMA-informed analysis.
Key findings

64%
of rail lines at risk – up from 39% in the FEMA-informed analysis

39%
of roads and highways at risk – up from 14% in the FEMA-informed analysis

21%
of rail stops at risk – up from 7% in the FEMA-informed analysis

11%
of bus stops at risk – up from 4% in the FEMA-informed analysis
“Integrating Fathom’s data into our analysis allowed us to give our stakeholders a broader understanding of inland flood risk to transportation infrastructure. The data supports more robust decision-making and is applied across various planning horizons, from immediate tactical responses to long-term capital improvement plans.
Crucially, this improved foresight also plays a vital role in strengthening the region’s emergency services capabilities and overall preparedness by identifying vulnerabilities and resource gaps – before the events happen.”
Katherine Rainone, Transportation Resilience Planner at TPB (The National Capital Region Transportation Planning Board)

The results of the analysis hold across all asset types for both historical and future time horizons. They reflect how the Fathom dataset captures expanded floodplains by accounting for pluvial flooding and considering heavier precipitation and stronger storms in the future.
An updated mapping and resilience planning tool
To explore the results of the analysis, the TPB created an interactive mapping and resilience planning tool, which will inform long-term flood risk planning for road and rail.
Ultimately, the tool is improving TPB’s understanding of future inland flood risk. It is already being used to help planners as they make data-driven decisions and identify priority resilience investments aligned with the region’s adaptation and resilience goals and improve the region’s preparedness and resilience.

Fathom: filling data gaps and revealing infrastructure risk
Discover how Fathom’s US Flood Map can fill data gaps for a consistent, comprehensive view of risk to transportation and critical infrastructure.
Explore our US Flood Map, the most complete and technologically advanced flood map for the United States, and request sample data or speak to Fathom experts about how this product can help your organization.

Quote Traditional models often failed to capture the full spectrum of flood hazards, particularly evolving threats from riverine and surface water flooding driven by climate change. Fathom’s superior level of analysis has empowered TPB to make smarter, forward-looking planning and resilience investments.

Quote Integrating Fathom’s data into our analysis allowed us to give stakeholders a broader understanding of inland flood risk to transportation infrastructure. The data supports more robust decision-making across planning horizons, from immediate responses to long-term capital plans.
Related case studies

AXA: a cutting-edge catastrophe model for Europe
Learn how Fathom and AXA built a state-of-the-art catastrophe model that strengthens AXA’s financial resilience and regulatory reporting.
Arup & World Bank
Fathom & Arup demonstrate how rapid, data-driven flood modeling can quantify the impact of urban greening on flood extent, soil erosion, and urban heat. Discover how NBS can create more resilient cities.
Texas Water Development Board
Texas Water Development Board uses Fathom data, and others, to accelerate the development of the first statewide flood planning program in the absence of publicly available flood data.

FEMA’s Risk Rating 2.0
Fathom provided FEMA with a more accurate, up-to-date picture of US flood risk which informed how the NFIP prices insurance, using Fathom-US flood map.