-
Trigg, M.,
-
Birch, C.,
-

-
-
-
-
Yamazaki, D.,
-
Hirabayashi, Y.,
-
Pappenberger, F.,
-
Dutra, E.,
-
Simpson, A.,
-
Dottori, F.,
-
Hadzilacos, G.,
-
Winsemius, H.,
-
Kappes, M.,
-
Salamon, P.,
-
Ward, P.,
-
Rudari, R.,
-
Fewtrell, T.


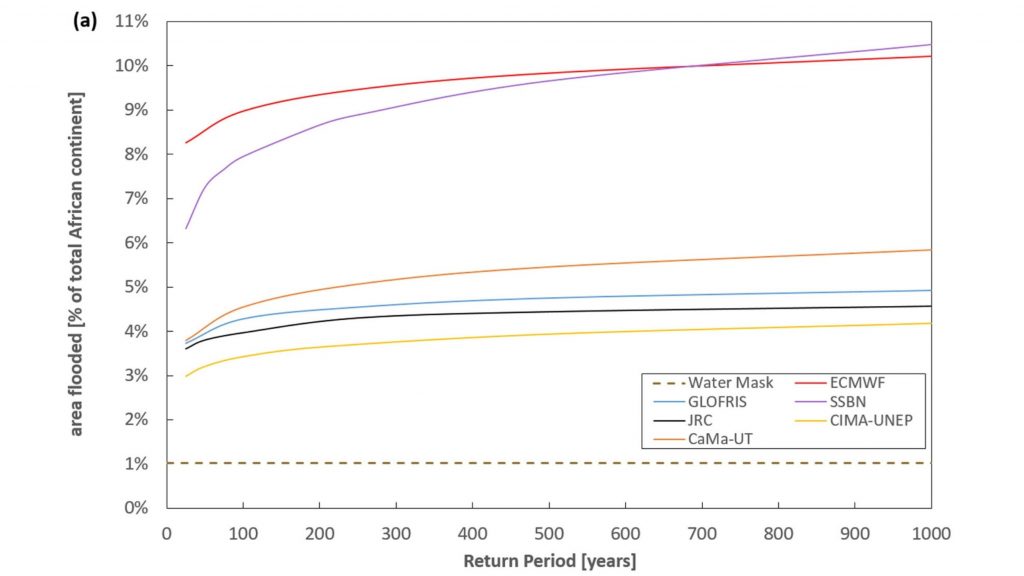
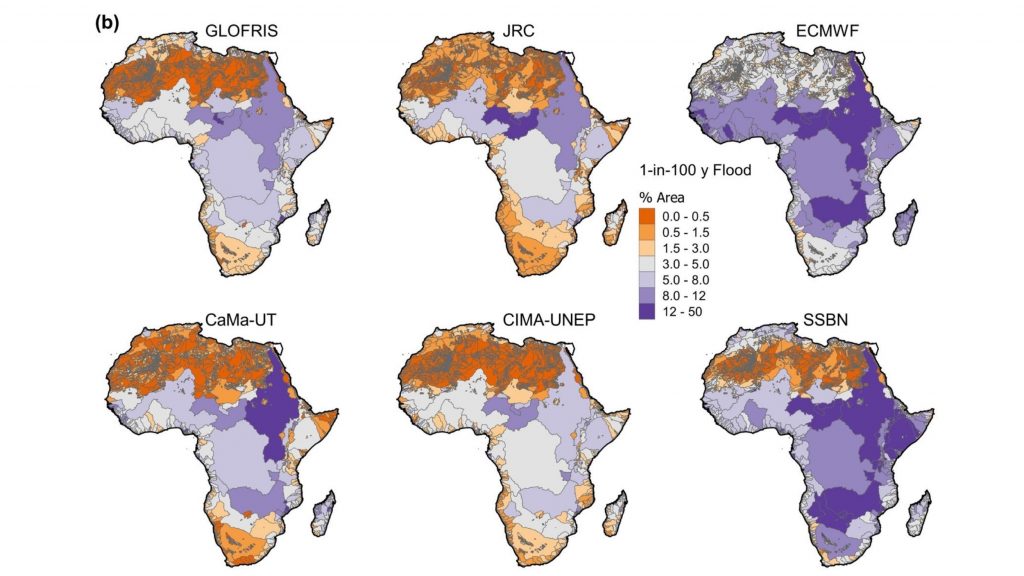
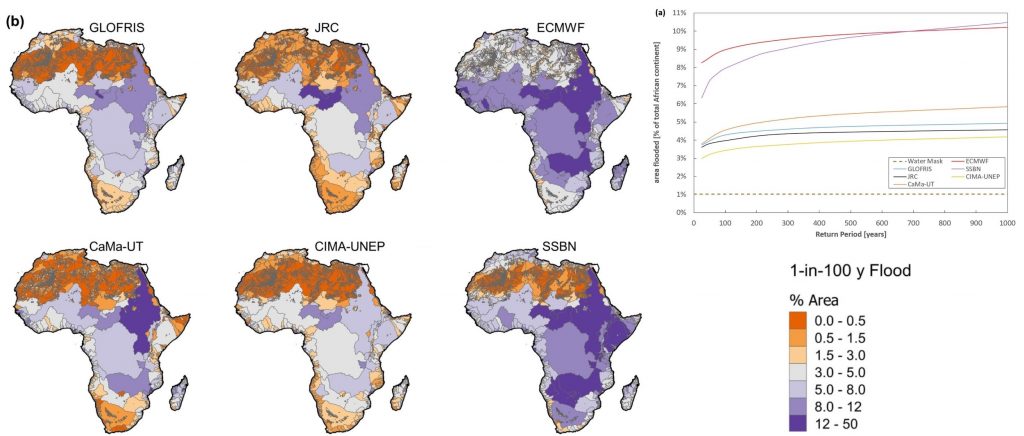
A collaborative paper that highlights the challenges posed by developing and refining the first generation of global flood hazard models.
Quantifying flood hazard is an essential component of resilience planning, emergency response, and mitigation, including insurance.
Traditionally undertaken at catchment and national scales, recently, efforts have intensified to estimate flood risk globally to better allow consistent and equitable decision making. Global flood hazard models are now a practical reality, thanks to improvements in numerical algorithms, global datasets, computing power, and coupled modelling frameworks. Outputs of these models are vital for consistent quantification of global flood risk and in projecting the impacts of climate change. However, the urgency of these tasks means that outputs are being used as soon as they are made available and before such methods have been adequately tested. To address this, we compare multi-probability flood hazard maps for Africa from six global models and show wide variation in their flood hazard, economic loss and exposed population estimates, which has serious implications for model credibility. While there is around 30%–40% agreement in flood extent, our results show that even at continental scales, there are significant differences in hazard magnitude and spatial pattern between models, notably in deltas, arid/semi-arid zones and wetlands. This study is an important step towards a better understanding of modelling global flood hazard, which is urgently required for both current risk and climate change projections.