
Measuring the impact of nature-based solutions
Fathom teamed up with Arup to demonstrate how urban greening can alleviate flood risk in Dar es Salaam with rapid bespoke modeling
Challenge Growing flood risk in Dar es Salaam
Dar es Salaam in Tanzania is one of Africa’s fastest-growing cities, with a population of around 5 million that is expected to double by 2050.
Low-lying and situated on the coast of the Indian Ocean, the city is regularly affected by severe floods, soil erosion and water scarcity – all of which are likely to be made worse by climate change and rapid urbanization.
To address these issues, the World Bank commissioned global sustainable development consultancy Arup to assess whether nature-based solutions (NBS) could help build resilience, alleviate climate vulnerabilities, reduce flood risk and improve the quality of life for people living in Dar es Salaam, now and in the future.
Opportunity Nature-based solutions for a more resilient city
Nature-based solutions such as tree-planting, rain gardens and roadside drainage systems, use natural processes to absorb and store excess water. Increasingly, they are being implemented as a cost-effective, less disruptive alternative to gray infrastructure. By comparison to grey infrastructure, greening interventions provide wider benefits such as carbon sequestration and reducing urban heat.
However, the impacts of NBS are rarely quantified. For this project, Arup teamed up with Fathom to provide tangible evidence of how different greening interventions can reduce the impact of flooding.
Solution Rapid flood modeling for informed decision-making
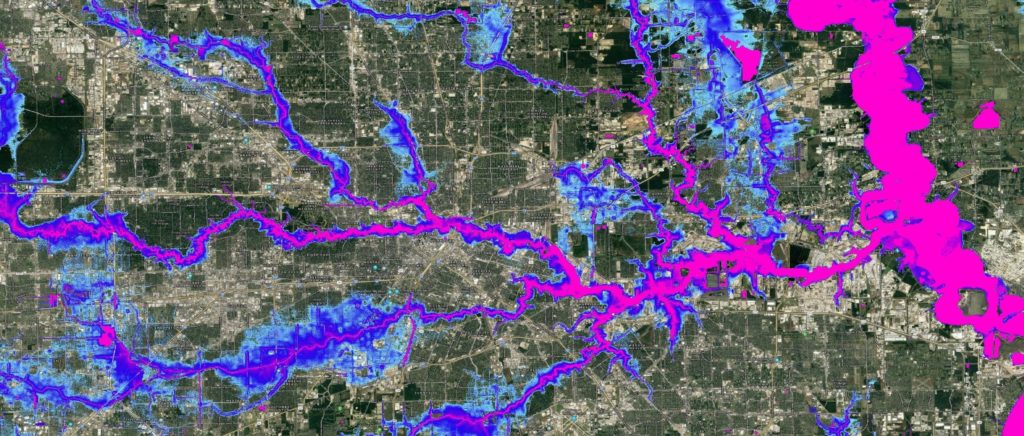
The Fathom team ran its 30 m resolution Global Flood Map to model fluvial and pluvial flooding in the city, for a range of climate scenarios for the present day, 2030 and 2040.
The model uses machine learning to create detailed flood maps, even in data-poor areas such as Dar es Salaam.
To model the impact of urbanization and NBS on flood hazard, Fathom incorporated Arup’s data, which estimated both the future pattern of urbanization and land use change; and the opportunities for urban greening and NBS.
The team rapidly ran their Global Flood Modelmodel to analyze flood risk in the ‘development as usual’ scenarios for 2030 and 2040, without NBS. They then reran the model, incorporating NBS in 2030 and 2040, to assess how these solutions changed the extent and depth of flooding in the city.
This rapid, automated approach to modeling various ‘what if’ scenarios was an innovative approach that generated results within days, easily meeting the project deadline.


Results Quantifying the impact of urban greening
Arup and Fathom were able to demonstrate the tangible benefits of using nature-based solutions to build climate resilience in developing regions, particularly in data-scarce areas.
They showed that, by harnessing the power of data-driven, nature-based interventions in Dar es Salaam:
- Up to 17,000 buildings could become less susceptible to flooding by 2030
- The city could absorb an additional 730,000m3 of rainfall in the soil – the equivalent of about 300 Olympic-size swimming pools
- Urban heat island effect could be reduced by 1-5°C
- Soil loss could be decreased by approximately 4%
This new rapid assessment approach and large-scale flood-mapping technique enables faster and improved decision-making and informs investment and infrastructure planning. The insights are now being used by the Government of Tanzania to introduce urban greening solutions into World Bank projects, creating a more climate-resilient environment for the people of Dar es Salaam.
This work was financed by the Tanzania Urban Resilience Program, a UK Foreign Commonwealth and Development Office-funded programme delivered by the World Bank, and the Quality Infrastructure Investment Partnership – financed by the Government of Japan.
How can urban greening resolve the challenges of rapid city growth?
Discover Fathom’s Global Flood Map
The first global flood map to provide risk professionals with all perils and climate options.
Discover more in the Engineering Matters podcast
Listen to the Engineering Matters podcast ‘Seeing the Future of a City’ to discover engineers from Arup made use of flood mapping from Fathom, as they calculated the impact of urban greening on the city.