
- Uncertainty is inherent within catastrophe models due to the complex nature of the scenarios they simulate and assumptions made by the model.
- Being aware of the different forms of uncertainty allows you to make more informed, robust decisions.
- Uncertainty is represented comprehensively within Fathom’s Global Cat Model, which means the user has the full spread, or distribution, of possible losses with which to make their risk management decisions.
Catastrophe models are designed not only to identify but also to quantify risk, in particular accumulation risk. To do this, they use hazard information alongside stochastic event catalogs and vulnerability functions to simulate extremely complex real-world scenarios.
With so many sources of variability and potential error, uncertainty can arise at any stage of the modeling process. But what does this mean in practice? We take a look at the types of uncertainty present in cat models and what it means for your decision-making.
Understanding cat model uncertainty
Uncertainty is inherent in catastrophe (cat) models. It can be introduced at every stage of the modeling process, whether through the representation of physical processes, the input data describing assets at risk or the methods used for hazard simulation.
While cat models attempt to quantify some of these forms of uncertainty, they do not account for all of them. That’s why it’s crucial for users to understand which types of uncertainty are and are not included in a model’s design so they can interpret the model results appropriately and responsibly.
In this insight, we break down different types of uncertainty you need to be aware of.
Epistemic vs aleatoric uncertainty
First, there are two main categories of uncertainty. They are:
Epistemic uncertainty
This uncertainty arises from a lack of knowledge or understanding – for example, uncertainty in model parameters such as rainfall intensity or soil conditions or gaps and inaccuracies in exposure data.
Epistemic uncertainty can, in theory, be reduced with better data and better scientific understanding. In practice, however, epistemic uncertainty in the representation of hazard is often only partially captured in catastrophe models. This is because it is resource-intensive and complex to build a single view of hazard, let alone a multitude of possible alternative views representing different assumptions, choice of parameters and modeling methodologies.
Aleatory uncertainty
Aleatory uncertainty arises from the inherent randomness and natural variability of physical processes.
Unlike epistemic uncertainty, it cannot be eliminated through improved knowledge, although it can be better characterised. Even if we know a flood is likely, we cannot predict with certainty the timing, location or severity of the event. Cat models usually represent aleatory uncertainties by using probability distributions (e.g. thousands of simulated stochastic events).
Uncertainty in event generation
Cat models aim to model the effects of physical processes such as flooding and earthquakes, which are inherently uncertain. There’s natural variability in where, when and how severe these catastrophes are that cannot be accurately predicted.
This type of uncertainty is also called “process risk” and is an aleatory uncertainty (see above). The event set within a catastrophe model considers this event uncertainty by including thousands of realisations of real-world events. This uncertainty is present within all models and is very hard to reduce due to the physical nature of the world.
Exposure data quality
Exposure data quality is one aspect of a cat model where uncertainty can be controlled.
Before the use of cat models became widespread, insurers generally used basic exposure data aggregated at the city or regional levels. Cat models quickly demonstrated that more detailed data led to better risk estimates.
Details such as building construction and occupancy, and precise geocoding are used by insurers to improve granularity, accuracy and consistency of exposure data.
Now, cat models are a critical part of the insurance industry. The demand for actionable insights is high, so there’s a direct requirement for high-quality exposure data. However, the availability of this is not the same worldwide.
A variety of factors influence the availability and quality of exposure data. Wealth, regulatory pressure and the availability of established cat models can lead to higher-quality exposure data. For example, US hurricane portfolios usually have very high-quality exposure data. Regions with small insurance markets and newer models for perils such as flooding often lack, or have poor-quality, exposure data. Sometimes, insurance submissions in these regions only provide aggregate exposure data with very limited information about the individual assets covered by the policy.
How Fathom represents location uncertainty

If the precise location of an asset is not known, then it’s important that the model and user take location uncertainty into account. It is crucial to understand how your cat model treats this location uncertainty, particularly when it comes to flood, as a small positional error (just tens of meters) can mean the difference between an asset being above or below flood level. If a precise location is not known and only the postcode is provided, what does the model do? Does it use the postcode centroid and assign the hazard based just on that single coordinate, or does it assume a range of possible locations within the postcode and increase the uncertainty in model results accordingly?
Fathom’s Global Flood Cat represents location uncertainty by sampling from the distribution of flood depths across all grid cells in an asset’s reported area, rather than assuming a fixed location. That’s because if an asset is only known at the postcode level, choosing a single point to estimate risk could lead to misleading results.
Global Flood Cat’s sampling method means that the uncertainty arising from not knowing where an asset is located within a postcode will be represented.
Uncertainty in hazard
There is significant uncertainty in the assignment of detailed hazard intensity to each grid cell impacted by each event. This stems from:
- Incomplete or inconsistent data used to build the event set and hazard models.
- Variance in the methods and parameters used – different development teams using the same data may create different models due to subjective decisions.
Sensitivity in flood modeling
Flood modeling is complex and inherently uncertain. Multiple factors have varying influences over time and space, which emphasizes the need for transparent communication regarding modeling choices and uncertainties.
This was illustrated in a study by Savage et al (see figure below), which explored flood model sensitivity to multiple factors including spatial resolutions (grid size), boundary conditions (input of water onto the grid), channel (where the rivers are) and floodplain parameters (conditions that impact flooding, e.g. rainfall, land use, soil type) and digital elevation models (surface height).
The study highlighted the varying influence of different factors over time and space, emphasizing the need for transparent communication regarding modeling choices and uncertainties. It found that choices concerning spatial resolution and model parameters significantly impact flood model outputs, underscoring the importance of modelers communicating their choices and uncertainties to users.
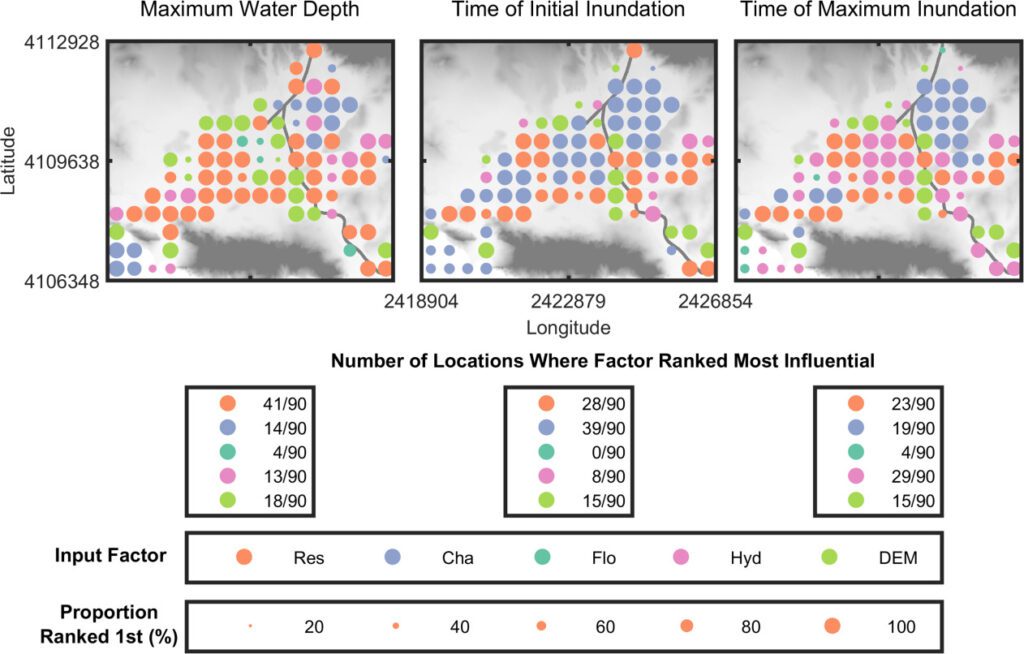
Nodal maps showing the spatial distribution of the most influential input factor for the maximum water depth, time of initial inundation, and time of maximum inundation model outputs. The color of the dots represents the most influential factor, and the size of the dots represents the proportion of bootstrap resamples where that factor was ranked most influential. Each point is separated from the others by 500 m. The background on the plots is the 2m LiDAR DEM, which has dimensions of 7.95 × 6.58 km. The input factor abbreviations are outlined above.
Uncertainty in vulnerability
Uncertainty in vulnerability is also known as secondary uncertainty (see box below). The relationship between hazard and damage is typically uncertain. The reasons for this uncertainty are complex but are likely to stem from:
- Variance in assets not captured, e.g. buildings with flood resistance materials, or high-value items being stored on the 1st floor vs the ground floor.
- Delays in claims settlement leading to increased damage
- Errors in flood depth assignment
- Errors in insured loss reporting
- Scarcity of damage data
It’s very important that this type of uncertainty is properly reflected in models to avoid errors in the distribution of loss estimates and the quantification of the impact of non-proportional financial terms.
Primary vs secondary uncertainty
Understanding both primary and secondary uncertainty is an important part of assessing risk.
Primary uncertainty
Primary uncertainty concerns the event generation part of a model and is related to the natural variability and unpredictability of geophysical processes. It is about whether an event occurs and how severe it is, e.g. wind speed, amount of rainfall or the extent and depth of flooding.
Secondary uncertainty
Secondary uncertainty is related to the uncertainty in estimating the damage and loss after an event has occurred. For example, how much damage a house incurs if it’s built with certain materials and is subjected to wind speeds of 160 mph. Sources of secondary uncertainty include exposure data quality and building vulnerability (see Uncertainty in vulnerability, above).
Correlation of uncertainty
Cat models represent accumulation risk. It’s important to understand how uncertainty is correlated across assets, as this will impact modeled loss. As an illustration of why correlation matters, let’s look at a flooding case:
- Location A has been flooded to a depth of one foot, and the model draws a random number of 0.7 for its first sample.
- The model will use this to lookup the appropriate damage ratio from the damage ratio distribution for location A. For example, a flood depth of one foot at the 70th percentile may equate to a 40% damage ratio.
- The model will now consider location B, which is flooded to a depth of three feet in the same event.
- If the damage uncertainty between A and B is uncorrelated, the model will draw another random number between 0 and 1 and use this to look up the damage ratio for location B.
- However, if the damage uncertainty was fully correlated between A and B, the model would use 0.7 and would look up a damage ratio using this. For example, a 60% damage ratio as the flood depth is higher.
This is just one example. Other examples of uncertainty correlation include:
- Correlation between different coverage types (e.g. buildings vs contents vs time element loss)
- Correlation between sub-perils (e.g. pluvial, fluvial and coastal flood), both in hazard and in damage
Cat model users should ensure they understand which types of uncertainty are represented by the model and how uncertainty is correlated across their assets or exposure, as this will impact modeled loss, especially at low probabilities.
Uncertainty by use case
Catastrophe models have many different uses, and the importance of understanding uncertainty and its implications will differ depending on the application of the model. Users should clearly understand model inputs, methods and assumptions and how these might have impacted the uncertainty surrounding quantification of loss.
All of these types of uncertainty need to be considered when you evaluate your model.
Transparency and uncertainty in Fathom’s Global Flood Cat
It is critical for the user to be aware of what is and isn’t represented in a model’s handling of uncertainty, so that they can interpret the results accordingly.
Fathom provides full transparency around what is and isn’t included in our flood catastrophe model, Fathom Global Flood Cat, and we subject all of our data and methods to the scrutiny of peer review.
Uncertainty around hazard is captured by probabilistic modeling and simulation – the Global Flood Cat simulates 10 million events over 10,000 years to map out a range of possible ‘what-if” scenarios. It also provides transparency by including a dedicated layer of metadata to quantify confidence levels.
- Metadata Certainty Ranks: Fathom provides a 1 to 10 scale (certainty ranks) that quantifies confidence in their flood map data, with 1 being the least uncertain.
- Terrain Metadata: These contain information regarding the underlying terrain data, such as the instrument type, resolution and vintage, to help users understand the data’s limitations.


It also includes damage uncertainty representation, covering scenarios from zero to total loss, and handles spatial correlation to ensure that uncertainties are correctly propagated into final risk metrics.
By incorporating these and other methods, Fathom provides a “view of the risk” that acknowledges the uncertainty inherent in climate and flood modeling.
Embrace uncertainty
Catastrophe models are invaluable, but to use them effectively, it is crucial to embrace and better understand the uncertainty that’s inherent within them.
In this article, we’ve looked at the many aspects of uncertainty in cat models and how they’re fundamental to how models behave. However, in practice, there’s often undue confidence in model outputs.
Erica Thompson, in her book Escape from Model Land, describes this mindset as the trap of “Model Land”, a place where everything is known, exposure data is complete and accurate, hazard layers perfectly reflect the real world, and all assumptions hold true.
It’s easy to forget that models are a reflection of the real world, where the precision and surety we seek in forecasting doesn’t exist.
As we’ve discussed, uncertainty is inherent within cat models and embracing it can lead to a much deeper understanding of risk. It should be thought of as a feature, not a flaw. This requires rethinking from some model users to treat cat models as approximations and tools for navigating uncertainty, rather than a crystal-ball prediction.
This rethinking is no longer optional. As catastrophe models increasingly inform financial regulation, climate disclosure and asset-level pricing, users must be prepared to scrutinize their foundations.
Fathom’s Chairman, Professor Paul Bates, conveyed a similar message in a commentary examining the limitations of flood inundation modeling:
“If your flood data provider is offering individual asset-level data under future climate scenarios, you should be asking them a lot of questions.”
Users should always be asking:
- Where did the data come from?
- What assumptions underpin this model?
- What parts of the result are most sensitive or uncertain?
Models are just a tool. It’s people who make decisions
Catastrophe models are powerful tools. But they are only that: tools. Ultimately, the most important component in catastrophe modeling is the judgment of the person using the model.
Overreliance on the output can lead to flawed risk assessments. Instead of treating cat models as precise forecasting tools, we should see them as frameworks for understanding risk. If users remain curious, ask questions and embrace uncertainty, they can unlock more value from models and make better-informed decisions.
Not all catastrophe models are made equal
Ultimately, the cat model can only be as good as the judgment of the person using it. However, the benefits of using an accurate and innovative cat model should not be understated.
The Fathom Global Flood Cat model includes millions of potential flood events worldwide. You can leverage a range of customization options to tailor risk assessment to a huge range of scenarios, including residential, commercial and industrial assets. The ability to quantify financial risk across many future scenarios provides a climate-driven perspective on present and future risk.
Escape from model land: How mathematical models can lead us astray and what we can do about it
By Erica Thompson
If you work with catastrophe models or make decisions based on their outputs this book is a must-read. Thompson offers a compelling reminder that models don’t make decisions, people do, and that understanding the limits and assumptions behind our models is critical to using them wisely.
Jo Paisley, President of GARP interviews Erica Thompson on this phenomenon in an episode of GARP Climate Risk Podcast. Listen to the interview here.