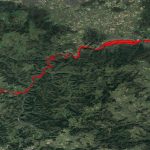
Hurricane Ian made landfall on the 28th of September, hitting western regions of Cuba before making its way across coastal and inland Florida

Event start
28th September (20 inches over South Eastern United States)Report issuing date
06th October 2022
The category 4 storm has now been classed as the fifth strongest hurricane on record to make landfall in the United States.
As part of Aon Impact Forecasting’s Automated Response Service, the organisation has produced modelled representations of Ian’s storm surge and flood impacts, using data from Fathom’s US flood hazard data.
The full contents of Impact Forecasting’s release are as follows:
Wind footprint
Storm surge footprint
Flood footprint
Calibration & validation
ELEMENTS Scenarios
Below is a short analysis created using a small sample of their data for Hurricane Ian.
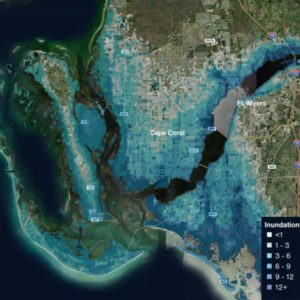
Modelled wind and storm surge
Hurricane Ian has been classified as a top-end category 4 storm. Analysis produced by the US National Hurricane Centre finds that the storm had maximum sustained winds of 155 mph at its peak, with maximum sustained wind speeds at landfall in Florida being 150 mph.
Regions across Central Florida sustained the highest impact, with some areas experiencing catastrophic damage to property and infrastructure, including power and communications. Regions in the direct path of the hurricane, like Fort Myers, experienced a recorded storm surge height of 7.26 feet.
In an interview with WLRN following the event, Craig Fugate, former head of FEMA and former director of Florida’s emergency management division, explained:
“This was probably the largest area of storm surge damage that we’ve seen in recent history,” he said. “People look at the images and say ‘that was wind.’ No, it was storm surge. That’s the power of water.”
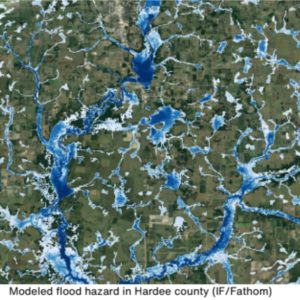
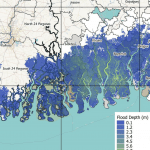
Pluvial flood
Alongside wind and storm surge, extreme rainfall has also been a major driver of losses from Hurricane Ian. Ian was recorded to have dropped more than 20 inches of rain at its height.
To create the event’s pluvial map, IF compiled pre-calculated pluvial hazard (from Fathom) for 24 hour rainfall return periods.
How can I access this data?
IF support users can download the document and spatial data using the link below. ELEMENTS Scenario files can be provided upon request.
If you are not an Impact Forecasting user, you will need to contact the Aon IF team who will share the footprint at their discretion.
Sources
- https://www.aon.com/home/contact-us.html
- https://www.noaa.gov/ian
- https://www.guycarp.com/insights/2022/09/Hurricane-Ian-9-280.html
- https://www.nesdis.noaa.gov/news/hurricane-ians-path-of-destruction
More response reports