Pioneering new research into the creation of the most comprehensive flood mapping framework to date highlights the impact of climate change on flood risk around the globe.
A trailblazing new study led by global water risk intelligence leader Fathom has revealed the most accurate projections of flooding under climate change to date.
It compares present day inland and coastal flood risk with a forecast for 2050 and 2100, demonstrating the impact of pessimistic high emissions scenario SSP5-8.5 with optimistic low emissions scenario SSP1-2.6, which is only feasible if all global carbon promises are met.
Key findings from the study include:
- Achieving the best-case low emissions scenario SSP1-2.6 limits the median flood hazard increase by 2100 to 9% compared to 2020 values, with a likely range of -6-29%.
- In contrast, the high scenario SSP5-8.5 will increase flooding by 49% by the end of the century, with a likely range of 7-109%.
- Near-term increases in flood hazard to 2050 are small; 7% under low scenario SSP1-2.6 and 15% in high scenario SSP5-8.5. There is heavy overlap in the range of what is likely by 2050 in both scenarios: -7–26% is the likely range for SSP1-2.6 and -5–43% for SSP5-8.5. After 2050, these ranges start to diverge.
- Coastal flooding continues to increase in both low and high scenarios due to the lagged response of the ocean to existing warming. Even under SSP1-2.6, coastal flooding is projected to increase by 99% by 2100.
- The largest increases in flooding can be found around global coastlines and in tropical Africa and Asia, in addition to relatively large changes to arid North Africa. However uncertainty around this is high. Most certainty in flood increases exists along the North Atlantic and Indian Ocean coasts, as well as southeastern Asia and the Pacific Islands.
- Large uncertainty surrounds climate forecasting, due to a range of limitations such as the lack of data to benchmark against, lack of flood defense information, and unavoidable errors due to missing data.
The below table highlights the predicted flood risk for different types of flooding.
Type of flood peril |
Increase in flooding by 2100 under the low scenario (SSP1-2.6) |
Increase in flooding by 2100 under the high scenario (SSP5-8.5) |
All |
9%Likely range: -6-29% |
49%Likely range: 7-109% |
Coastal |
99%Likely range: 47-168% |
287%Likely range: 217-377% |
Rainfall |
6%Likely range: -5-20% |
44%Likely range: 8-88% |
River |
6%Likely range: -9-29% |
45%Likely range: 0-116% |
Want to delve deeper into the findings of the research paper?
The research
Global and continental scale flood inundation models have existed for around a decade and have seen rapid development in terms of their resolution, physics, representation of climate change and underlying datasets. Use cases include estimating the national or global population exposed to floods; potential value of assets at risk; cost and benefits of flood defenses, and the impact of climate and socio-economic change on future losses. However, most represent only river flooding, with a hydrodynamic approach to coastal flooding thus far ignored – a significant omission.
Published in Water Resources Research, the study is the highest resolution and most physically robust global flood modeling effort to date and includes the most comprehensive validation of large-domain flood modeling yet published. It underpins the latest version of Fathom’s Global Flood Map, addressing a number of key challenges and taking advantage of recent advances in global data generation. These include:
- Comprehensive representation: For the first time, river, rainfall and coastal flood risk are all represented at the global scale.
- Climate conditioned: Representing any 21st century climate scenario.
- Unprecedented validation: When compared to numerous datasets for benchmarking, the model achieved a performance superior to any global model previously published. This is on par with national maps in many cases and close to the limits imposed by errors in observations of real floods.
- High resolution: Built upon a digital elevation model, FABDEM, which offers 30 m global resolution and has been shown to offer significant increases in vertical accuracy over other methods.
- Machine Learning (ML): Adopting new ML techniques to generate new flood frequency curves to better estimate flood intensity globally.
- Innovative river channel capacity estimation: Employs a recently developed approach to estimate river channel capacity, which yields notable improvements compared to alternative methods.
Interested in learning more about the product this research underpins?
High resolution graphs from the research paper are available for media use:
Image 1: A graph showing the change in global flood hazard under low (SSP1-2.6) and high (SSP5-8.5) climate scenarios expressed as the sum of A total, B fluvial (river), C pluvial (rainfall) and D coastal average annual flood volume. Shading represents the likely (17-83% chance) range based on climatological uncertainty (i.e. uncertainty in the historical baseline period and associated warming, and in the modeled future changes from the various climate models)
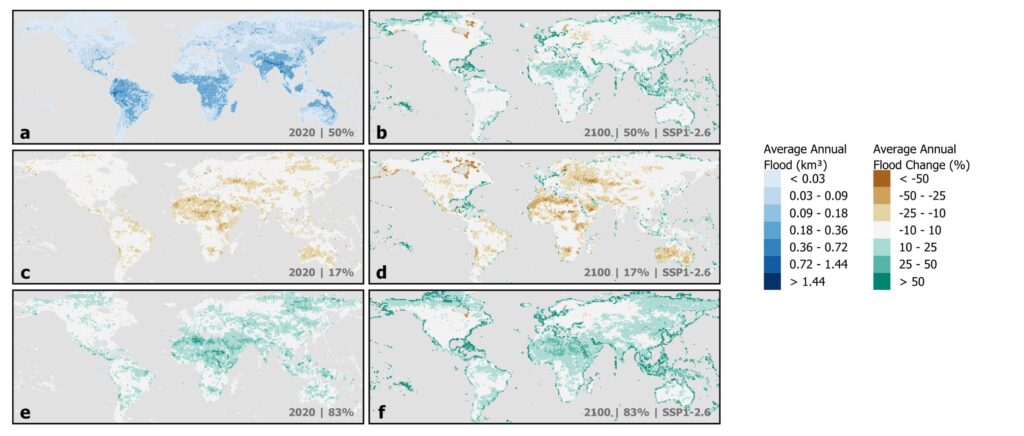
Image 2: Global flood hazard expressed as average annual flood volume per 1 degree tile. The central estimate of all global flooding in a 2020 climate is shown in A. B shows the median change in flood hazard under the low emissions scenario SSP1-2.6 by 2100.
For any further media enquiries, contact [email protected].
For more information, contact [email protected].
Note: In the study, ‘likely’ is defined as the increase that has between a 17% and 83% chance of occurring, in other words the one standard deviation range.