
In a step-change for flood risk mapping, Flood Factor enables individuals to view a flood rating based on Fathom flood hazard data for any address across the continental US. Anyone now using the platform is able to provide their own input on the data generated, from identifying potential discrepancies to offering valuable insight into local flood protection at a granular level never before gathered on this scale.
This crowd-sourced feedback is absolutely vital for validating and improving the flood risk maps that Fathom-USv2 delivers. Local input is reviewed and fed into the next release of the dataset, creating a model that iteratively improves year-on-year. Following the recent launch of Flood Factor, we are already receiving valuable feedback from users across the US, from amateur hydrologists to professional drainage professionals and engineers with extensive knowledge of the local area.
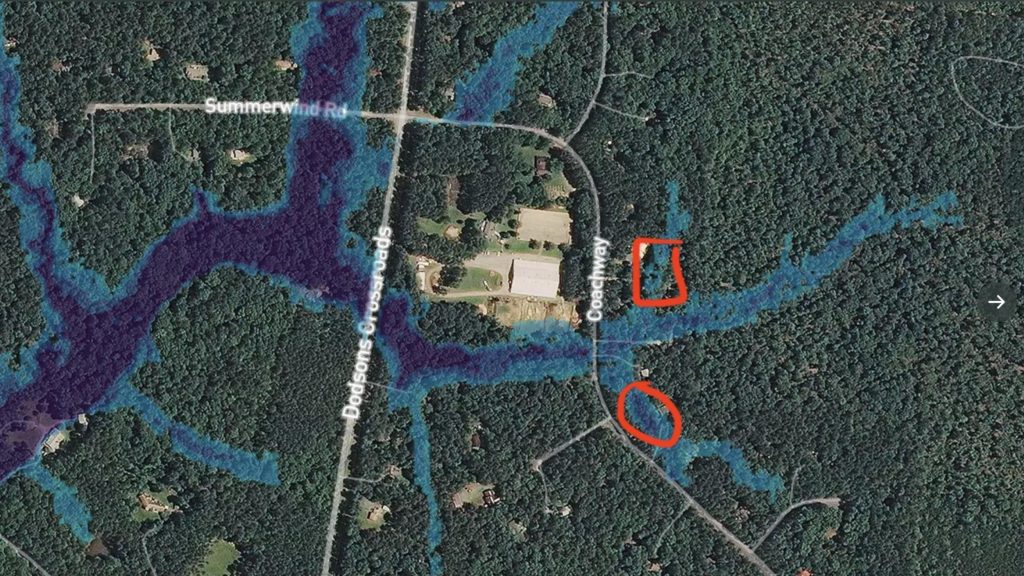
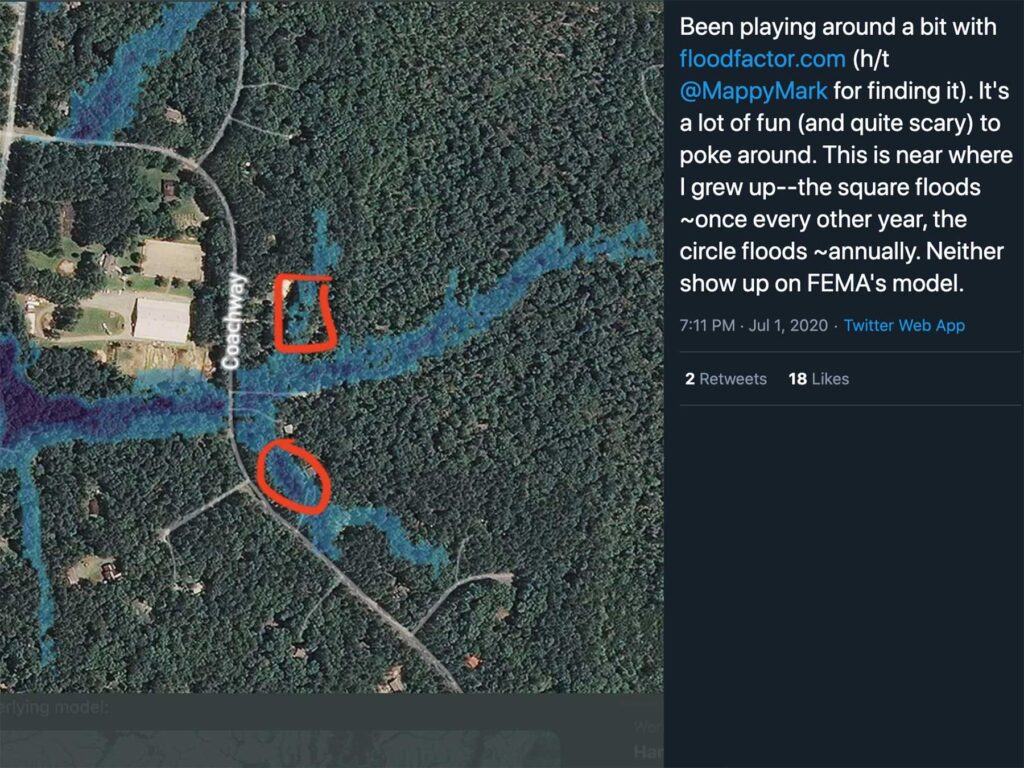
One Twitter user submitted a map with highlighted areas, tweeting: “Been playing around a bit with Flood Factor…it’s a lot of fun (and quite scary) to poke around. This is near where I grew up – the square floods approximately once every year and the circle approximately annually. Neither show up on FEMA’s model.” He added that it was a “very slick user experience and awesome that it’s built by a non-profit First Street Foundation that has opened a ton of documentation on the underlying model.”
His validation was echoed by a user from North Carolina, who commented: “Your flood analysis for our property is clearly more accurate than maps we have seen from other sources.” They went on to provide additional detail on their local drainage lines, saying: “We have lived in this home for 6 years with multiple hurricanes and never experienced a flooding problem. But there is a reason why. When this home was built in 2001, first occupied February 2002, the City of Greenville installed a buried drainage line along the west side of the house, extended to the back of the lot behind the detached shop building and extended to the backyard of an adjacent property (near the pool). We have watched these drains protect our property during hurricane heavy rain and appreciate the decisions and expense of almost 20 years ago.”
A user from Ohio commented: “I provide some technical support from time to time to Springfield Conservancy District, the flood conservancy district for Springfield, OH. As an instructor at a small liberal arts college in Springfield, I found your FloodFactor tool both interesting and provocative and was considering its possibilities for my hydrology course. I am trying to reconcile your model result (6.2-6.9 ft of flooding from the 100-yr (1 %) event for this location. BOE calculations using modest average velocity, 4-6 ft/sec and a cross sectional area consistent with 6.2 ft above the lowest point on the property, gives me a discharge 4-5 times the maximum observed flood (based on 60 years of record), prior to the construction of a flood control dam and reservoir upstream, constructed by the USACE on Buck Creek from this site.”
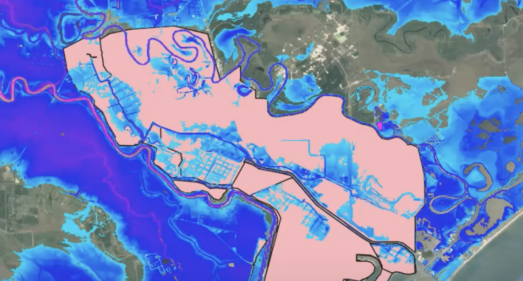
One Flood Factor user sent in a series of highly detailed images, commenting: “This submission is in reference to Montgomery County Texas along the West Fork of the San Jacinto River – downstream of the I 45 bridge. As I look at additional areas near River Plantation and farther downstream, I continue to see an under-representation of the extent of the inundation and structures that were flooded in previous floods (Oct 1994, the 2016 Tax Day and Memorial Weekend floods as well as Harvey in 2017.)” She went on to highlight potential discrepancies between inundation risks from the area shown by FEMA and Flood Factor
As part of the public-facing feedback loop, all requested modifications sent through to the Flood Factor team will be reviewed and validated and, if relevant, will be included for the next annual update of the Fathom-USv2 model.