-
Hawker, L.,
-

-
Paulo, L.,
-
Sosa, J.,
-
-
-


Research explores one of the biggest step changes in global flood modeling capabilities since the advent of the field
Introducing FABDEM: the first global elevation model with buildings and forests removed at 1 arcsecond (∼30 m) grid spacing.
Following the public release of the Copernicus GLO-30 DEM in 2021, researchers from the University of Bristol and Fathom harnessed machine learning to create FABDEM: Forests and Buildings removed from the Copernicus Digital Elevation Model.
In their paper, published in Environmental Research Letters, the team describes the methods and approaches underpinning FABDEM. Their goal was to create a digital elevation model (DEM) that strengthens assessments in need of high-quality ‘bare earth’ data, particularly flood simulations, for every location in the world. Through the peer-reviewed research paper, the resulting DEM is subjected to validation, which finds that FABDEM is more precise than existing DEMs and reduces absolute vertical errors in urban areas and forests by up to a half.
Today, FABDEM is seamlessly blended with enhanced local data to provide best-in-class elevation data everywhere in the world. The result is FABDEM+.
Understanding flood risk in a changing world
Digital elevation models provide crucial topographic information for a diverse range of disciplines, from ecology and volcanology to glaciology and hydrology. Existing DEMs contain forest and building artifacts. These reduce the precision of the models and can limit their usefulness; how can you model how a flood flows through a city when the model shows ground level as the top of the buildings? Clearly, many applications would benefit from a DEM with improved resolution and more accurate terrain heights.
The team’s Environmental Research Letters paper first describes the landscape of existing DEMs and how they work. In short, DEMs are developed by measuring the Earth’s elevations from space using near-infrared, LiDAR, radar and visible sensors. DEMs are available at the global scale, or near-global scale, at 1 arcsecond (∼30 m) grid spacing. Examples include Shuttle Radar Topography Mission (SRTM), TanDEM-X 30, and Copernicus GLO-30, ASTER GDEM (v3) and ALOS World3D AW3D30 (v3.2).
The accuracy of each DEM (and therefore its suitability for a given application) varies according to its:
- Acquisition period
- Sensor type
- Processing
- Post-processing
- Geographical extent
Prior to FABDEM, the most recent and accurate global DEM was CopernicusGLO-30 or COPDEM30, which uses TanDEM-X satellite data. COPDEM30 has been described as the ‘gold standard’ for global terrain data.
Learn more about the next evolution in global elevation mapping, Global Terrain Data – FABDEM+
DEMs Existing DEMs: digital surface models vs. ‘bare earth’ digital terrain models
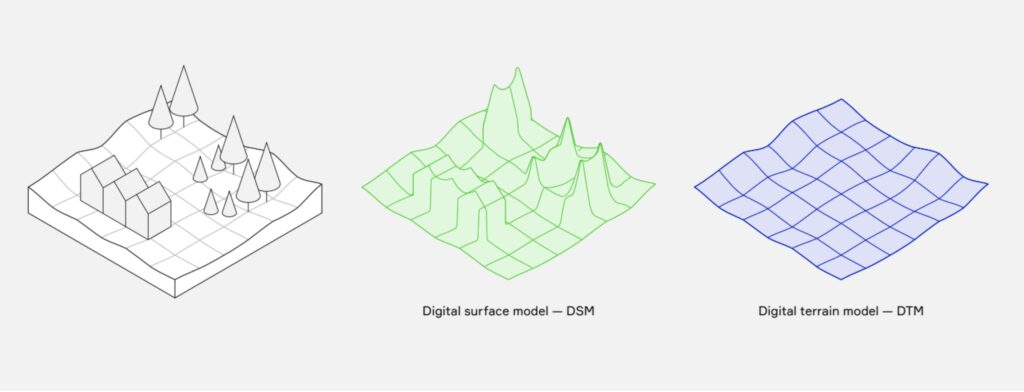
DEMs can be broadly defined as either:
- Digital surface models (DSMs). These measure the upper surface of trees, buildings and other artificial features.
- Digital terrain models (DTMs). These measure the ‘bare earth’ – that is, the elevation of the ground surface. These are preferable for hydrology and flood inundation modeling. In practice, DEMs measure both surface and terrain and will fall somewhere on a spectrum between the two categories. Each DEM produces a different abstraction of the real surface, and the user must decide which abstraction is best for their application.
DEMs at the global scale fall closer to DSMs. The MERIT DEM is an exception. It removes tree height bias, as well as absolute bias, speckle noise and striping. Tree and building artifacts in DEMs are especially problematic in hydrology. They can act as dams that change the flow of overland water in flood simulations.
However, MERIT DEM is yet to remove buildings at the global scale, and therefore it cannot be considered completely a DTM.
More recently, approaches inspired by FABDEM have been used to correct COPDEM30 over parts of the globe (e.g. DiluviumDEM, which covers coastal areas), however FABDEM still stands out as best-in-class for global DEMs.
Machine learning for more accurate terrain measurements
The research team made use of the rich global building and forest data that have become available in recent years. These data opened up the opportunity for the team to remove building and tree height bias from COPDEM30 using machine learning.
The team’s algorithm corrects for forests and buildings by estimating anomalies in the terrain. They trained the algorithm to recognise these anomalies by comparing COPDEM30 data with LiDAR reference elevation data (the most precise, but globally incomplete, terrain data available) for 12 countries. The LiDAR data covered a wide range of climate zones and urban extents.
The researchers post-processed the data to correct over-corrected areas or areas with noisy pixels. The end result was FABDEM: a bare-earth terrain dataset available between 60◦ S and 80◦ N at 1 arc second (∼30 m) grid spacing. It is the first global DEM to remove both trees and buildings and has much wider applicability than previous DEMs that are trained on data from a single country.
For full details of the methods, see Section 2 of the paper.
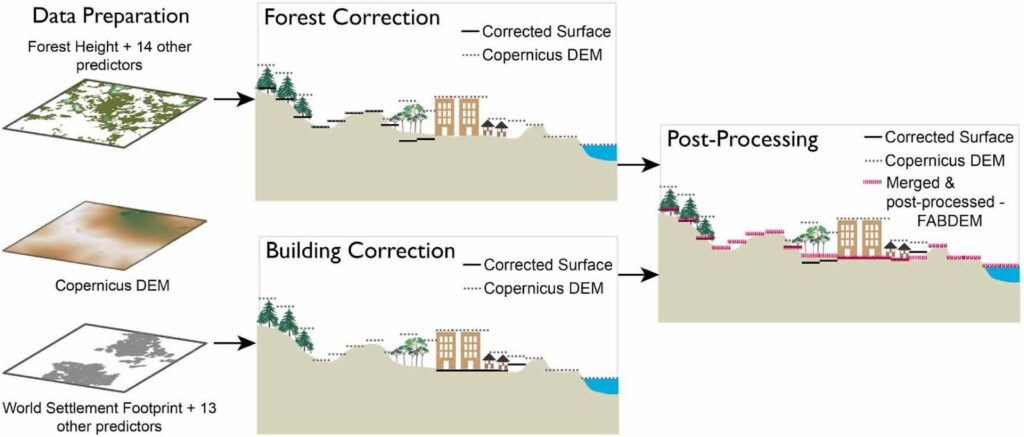
Figure 2: Schematic of the workflow to create FABDEM. Data preparation is followed by the forest and building corrections.
Validation Validation of FABDEM: how does it compare with other global DEMs?
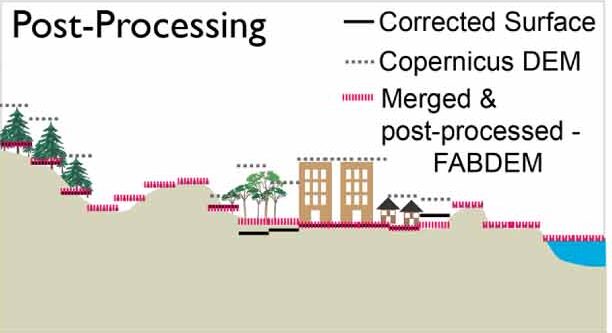
Figure 3. Elevation estimates: COPDEM30 vs. FABDEM.
To evaluate FABDEM’s accuracy, the team validated its data against two sources of reference elevation data:
- LiDAR data from 12 countries. These are the same countries that the study used to train the algorithm. The researchers, therefore, included reference data samples in the validation exercise that they had not used for the training.
- ICESat. These NASA satellite-based best estimates of the ground terrain were randomly sampled from locations around the globe.
The team then compared terrain data from FABDEM against those from leading global DEMs, including:
- COPDEM30, upon which FABDEM builds, and:
- MERIT DEM, which has had errors from vegetation removed and is, thus, most similar to FABDEM.
Key results of FABDEM validation
FABDEM has consistently lower errors than COPDEM30 and MERIT DEM.
Compared with COPDEM30, the next most accurate DEM, FABDEM’s method reduces mean absolute vertical error in:
- built-up areas from 1.61 to 1.12 meters
- forest from 5.15 to 2.88 meters
- boreal forest from 3.49 to 2.55 meters
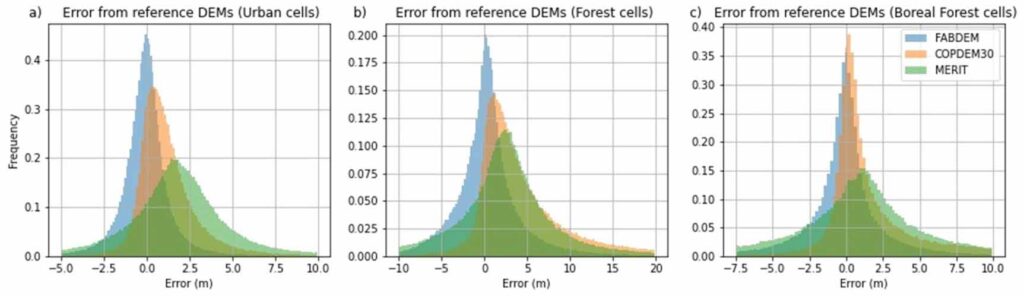
Figure 4: Histograms comparing FABDEM with COPDEM30 and MERIT DEM against reference data.
Error statistics comparing COPDEM30, FABDEM and MERIT DEM against reference data (LiDAR and ICESat)
| Area | DEM | Mean absolute error (MAE) |
| Urban | COPDEM30 | 1.61 |
| FABDEM | 1.12 | |
| MERIT DEM | 3.59 | |
| Forest | COPDEM30 | 5.15 |
| FABDEM | 2.88 | |
| MERIT DEM | 5.47 | |
| Boreal forest | COPDEM30 | 3.49 |
| FABDEM | 2.55 | |
| MERIT DEM | 9.38 |
How does FABDEM compare against other DEMs? A visual comparison
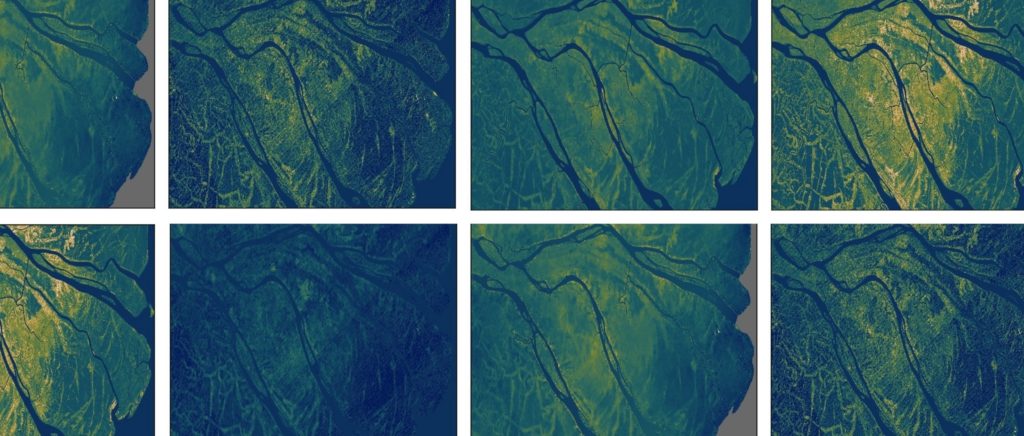
To further evaluate FABDEM’s accuracy, the research team conducted a visual comparison between its map of the Miami region, USA, and reference data from US NED. FABDEM was again compared with a range of other DEMs (see Figure 5).
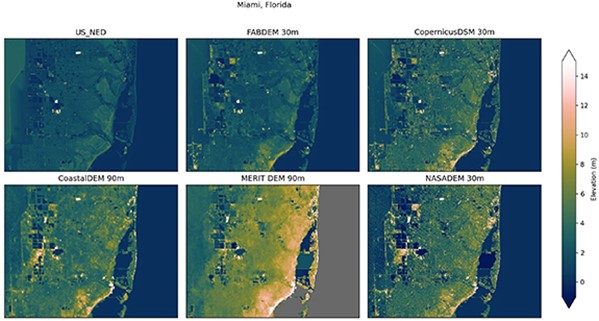
Figure 5. Visual comparison of different DEMs over a region of Florida, USA including Miami against the reference US NED.
Key results:
- FABDEM produces the closest comparison to the US NED reference DEM.
- FABDEM still contains artifacts from buildings in some locations, particularly along the coastal areas. However, there are fewer than in COPDEM30.
- Similar artifacts are also present in the other global DEMs.
Independent validation of FABDEM
More recently, a global team of independent scientists conducted further validation of FABDEM. They ranked FABDEM as the best 1 arcsecond global DEM. While the 2023 study acknowledges that FABDEM “cannot create a perfect DTM, and does not improve on COPDEM everywhere,” it concludes that: “FABDEM improves on COPDEM in most cases where a DTM is required.”
Fathom’s Product Stack – Methodology behind FABDEM
FABDEM forms the foundations of Fathom’s Global Terrain Data – FABDEM+ Global Terrain Data, which underpin its flood and catastrophe models. You can learn about the methodologies and datasets behind these products by exploring the Product Stack.
Conclusion
FABDEM offers key improvements in accuracy over existing global DEMs. It builds on the gold standard of global terrain data, COPDEM30, using powerful machine-learning models to estimate anomalies in the terrain derived from human settlements and forests. It is highly suited to assessments that need a bare-earth representation of terrain, such as those conducted in hydrology and flood inundation modeling.
Building on FABDEM, Fathom has created our Global Terrain Data – FABDEM+, which comprises consistent elevation data, up-to-date LiDAR imagery and comprehensive metadata that ensures access to the most accurate terrain information.
Read more about Fathom’s new standard for a globally consistent and accurate digital elevation model. Learn more about Global Terrain Data – FABDEM+